[算法]车道线检测
Abstract: 为了在线标定做的准备。识别车道线的经典算法,需要设置很多的超参数,暂时只是个demo。
直接写流程,放一些简单代码
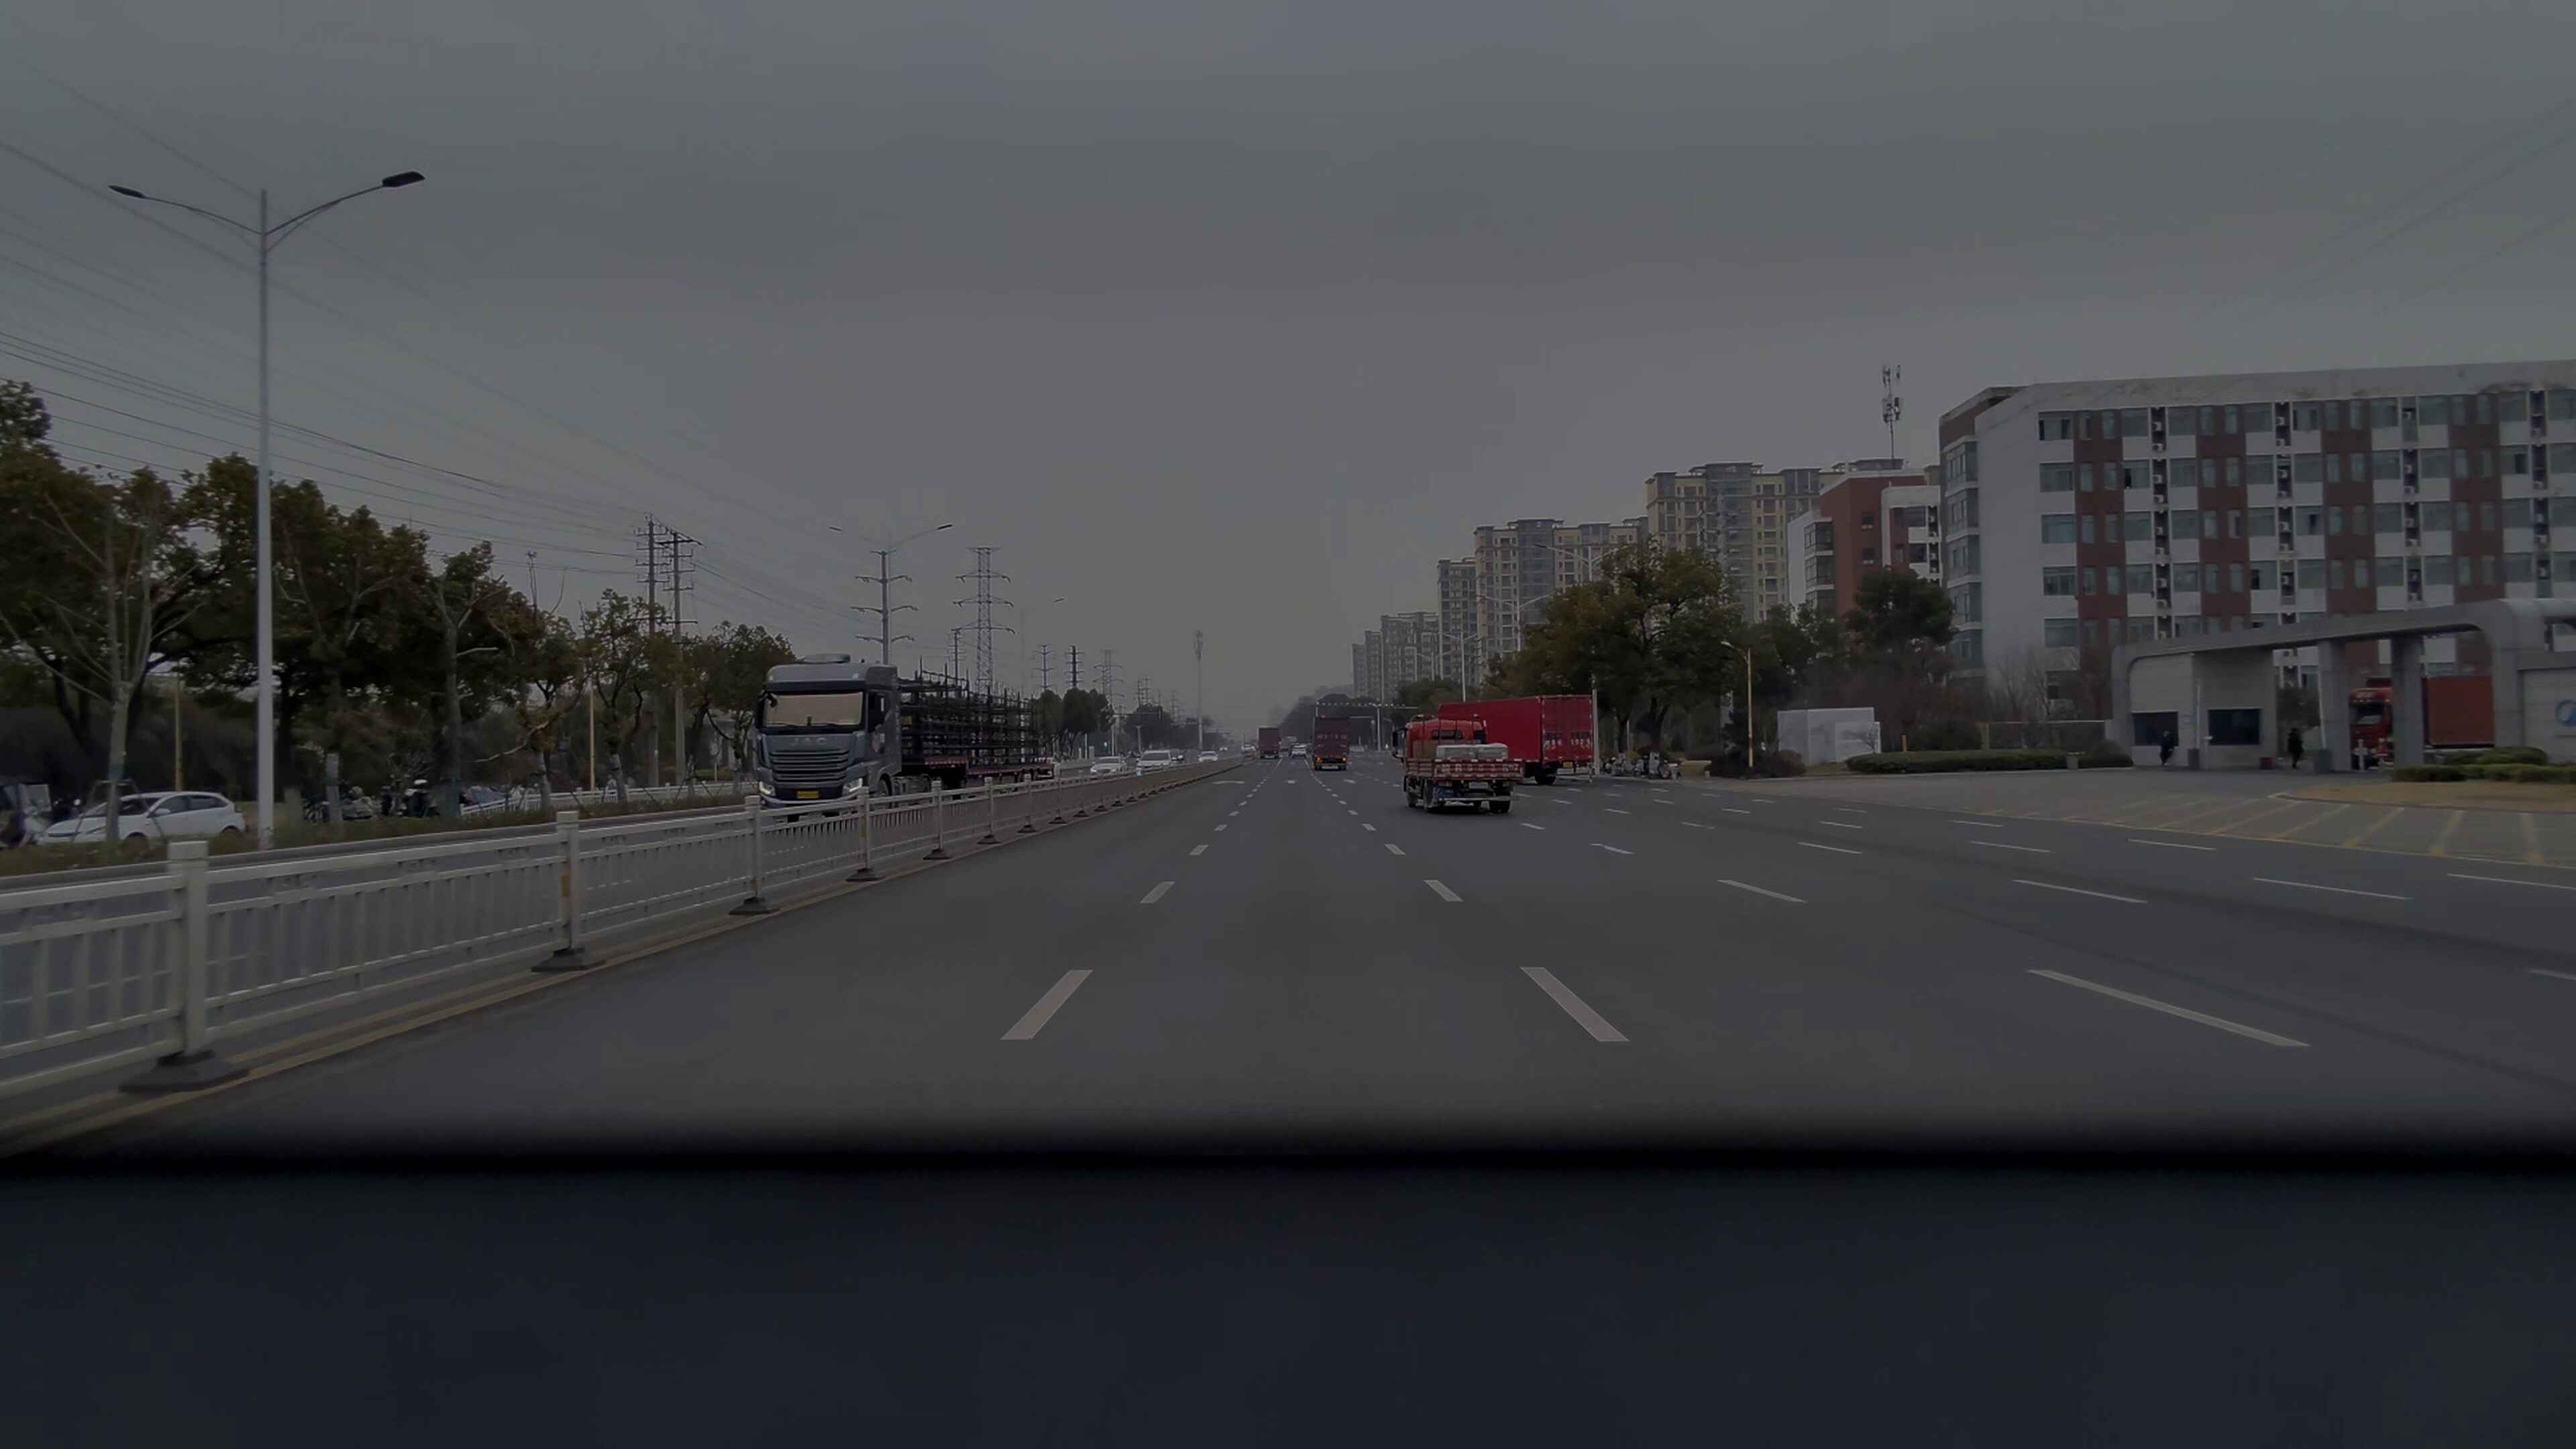
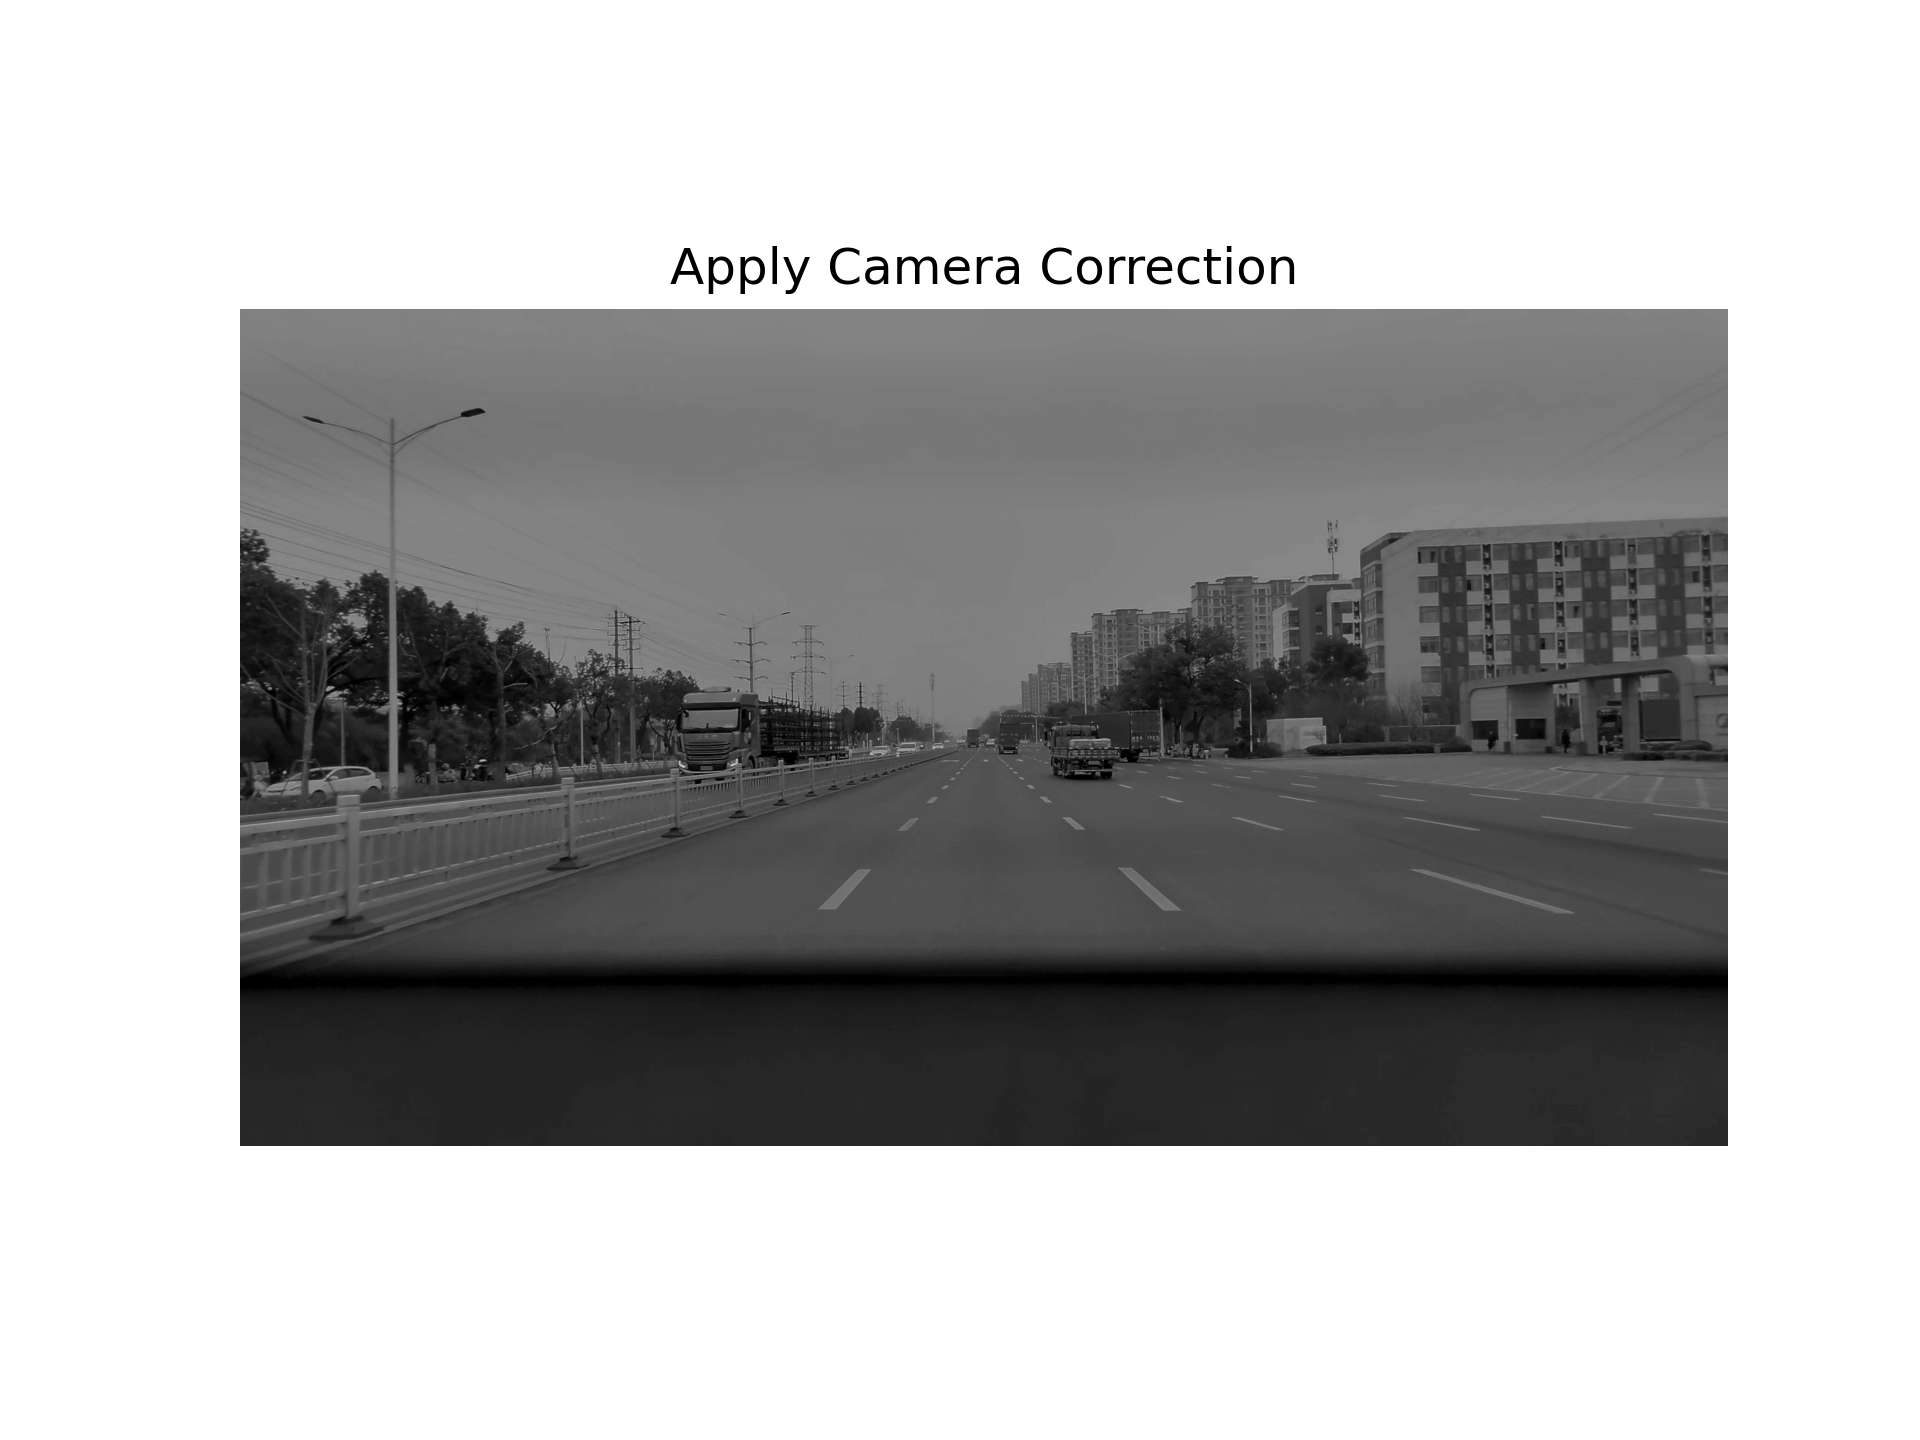
1.转灰度图以及x方向梯度转换
输入图片:
灰度图:
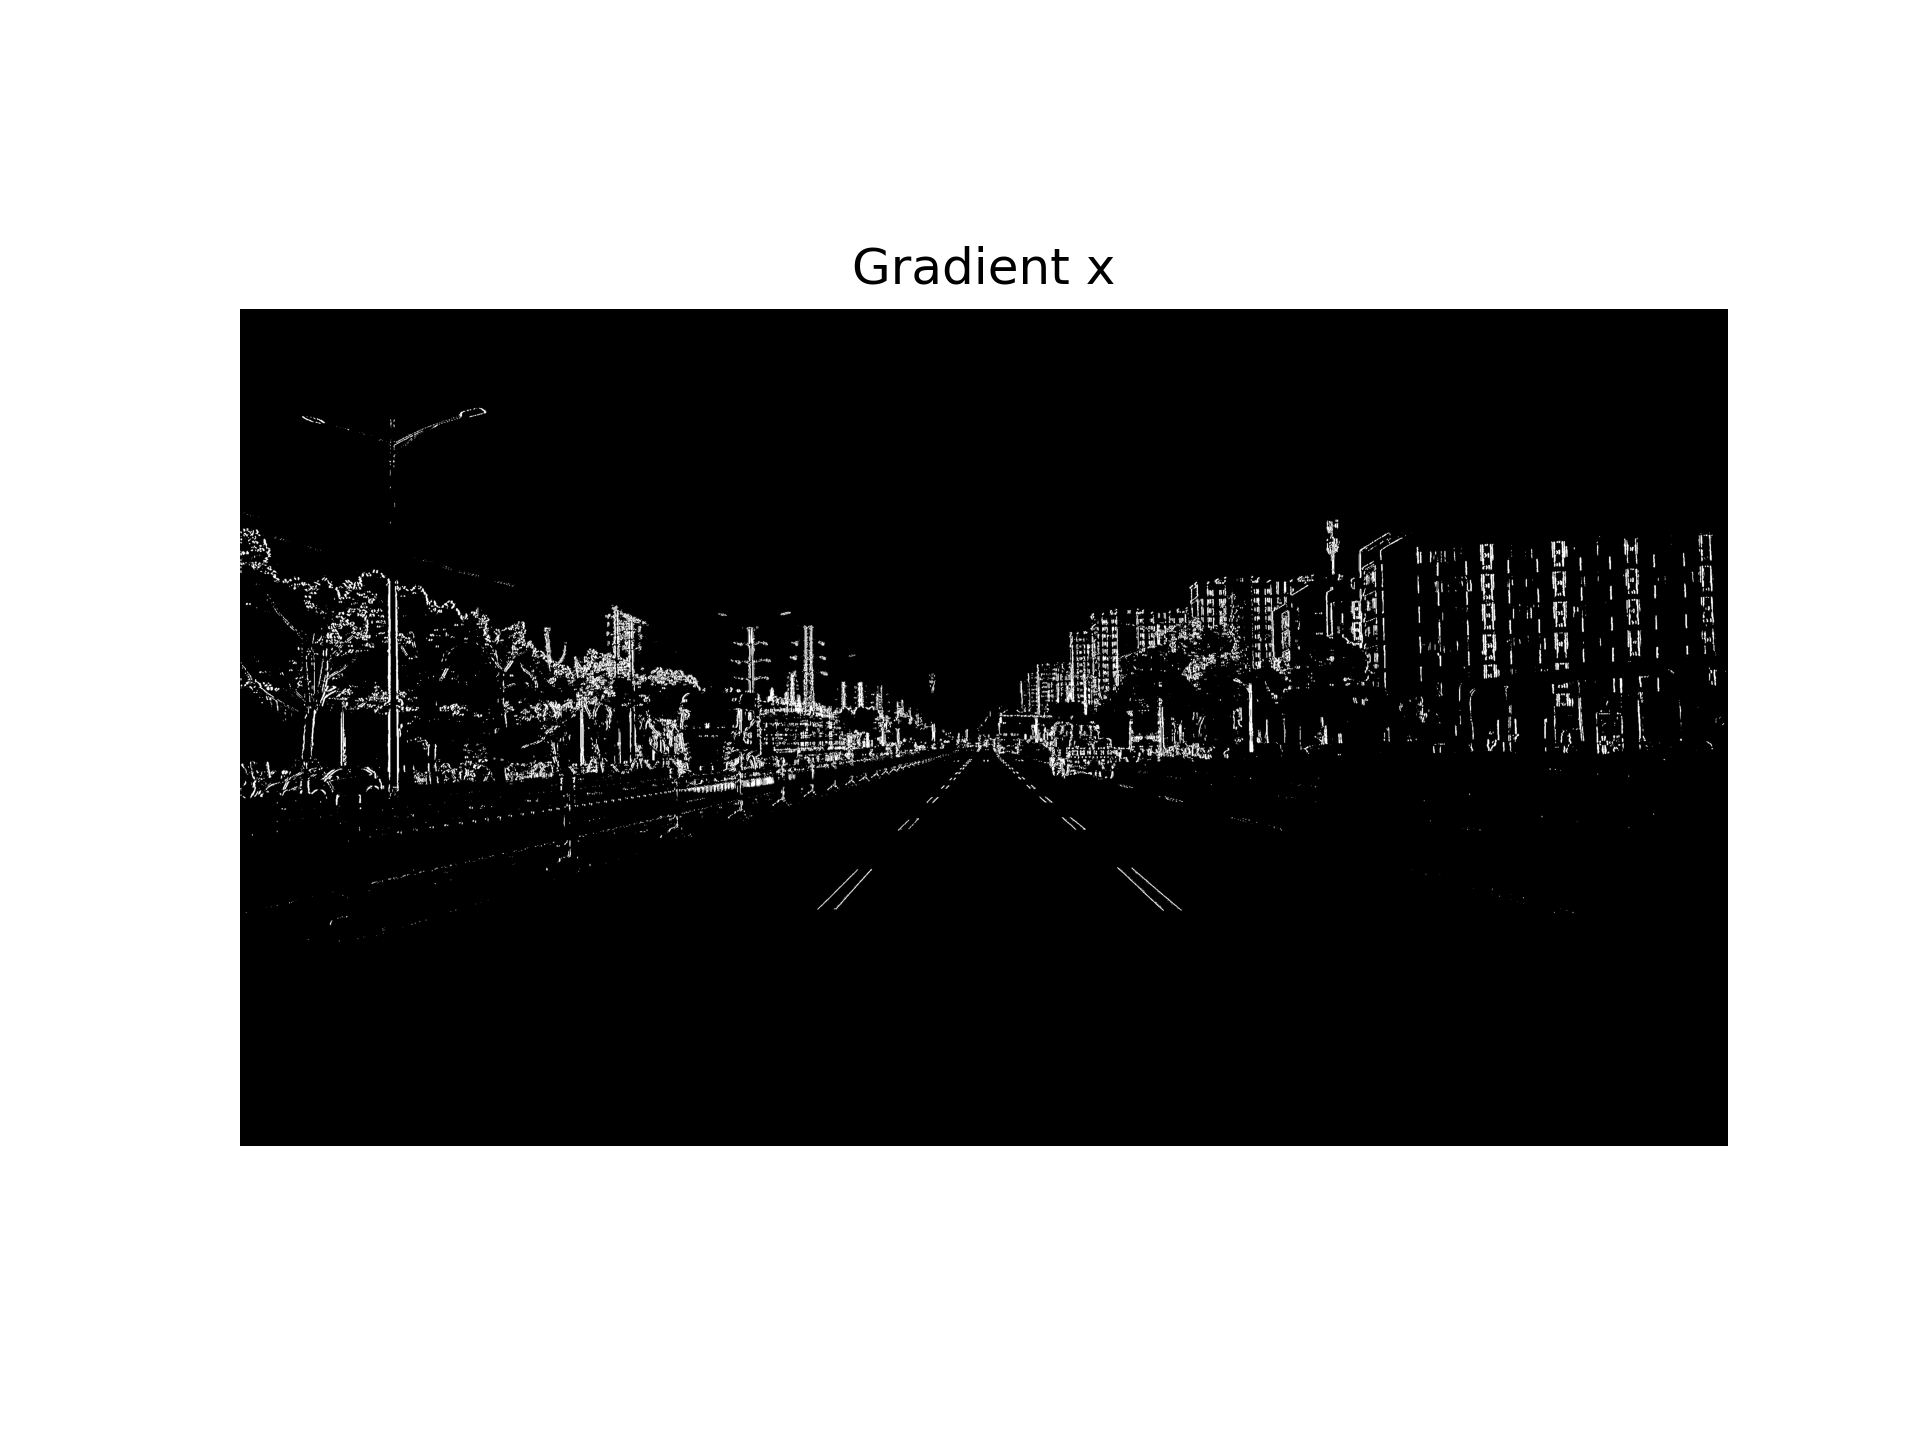
在x方向上使用sobel算子:
sobel = cv2.Sobel(img,cv2.CV_64F,1,0)
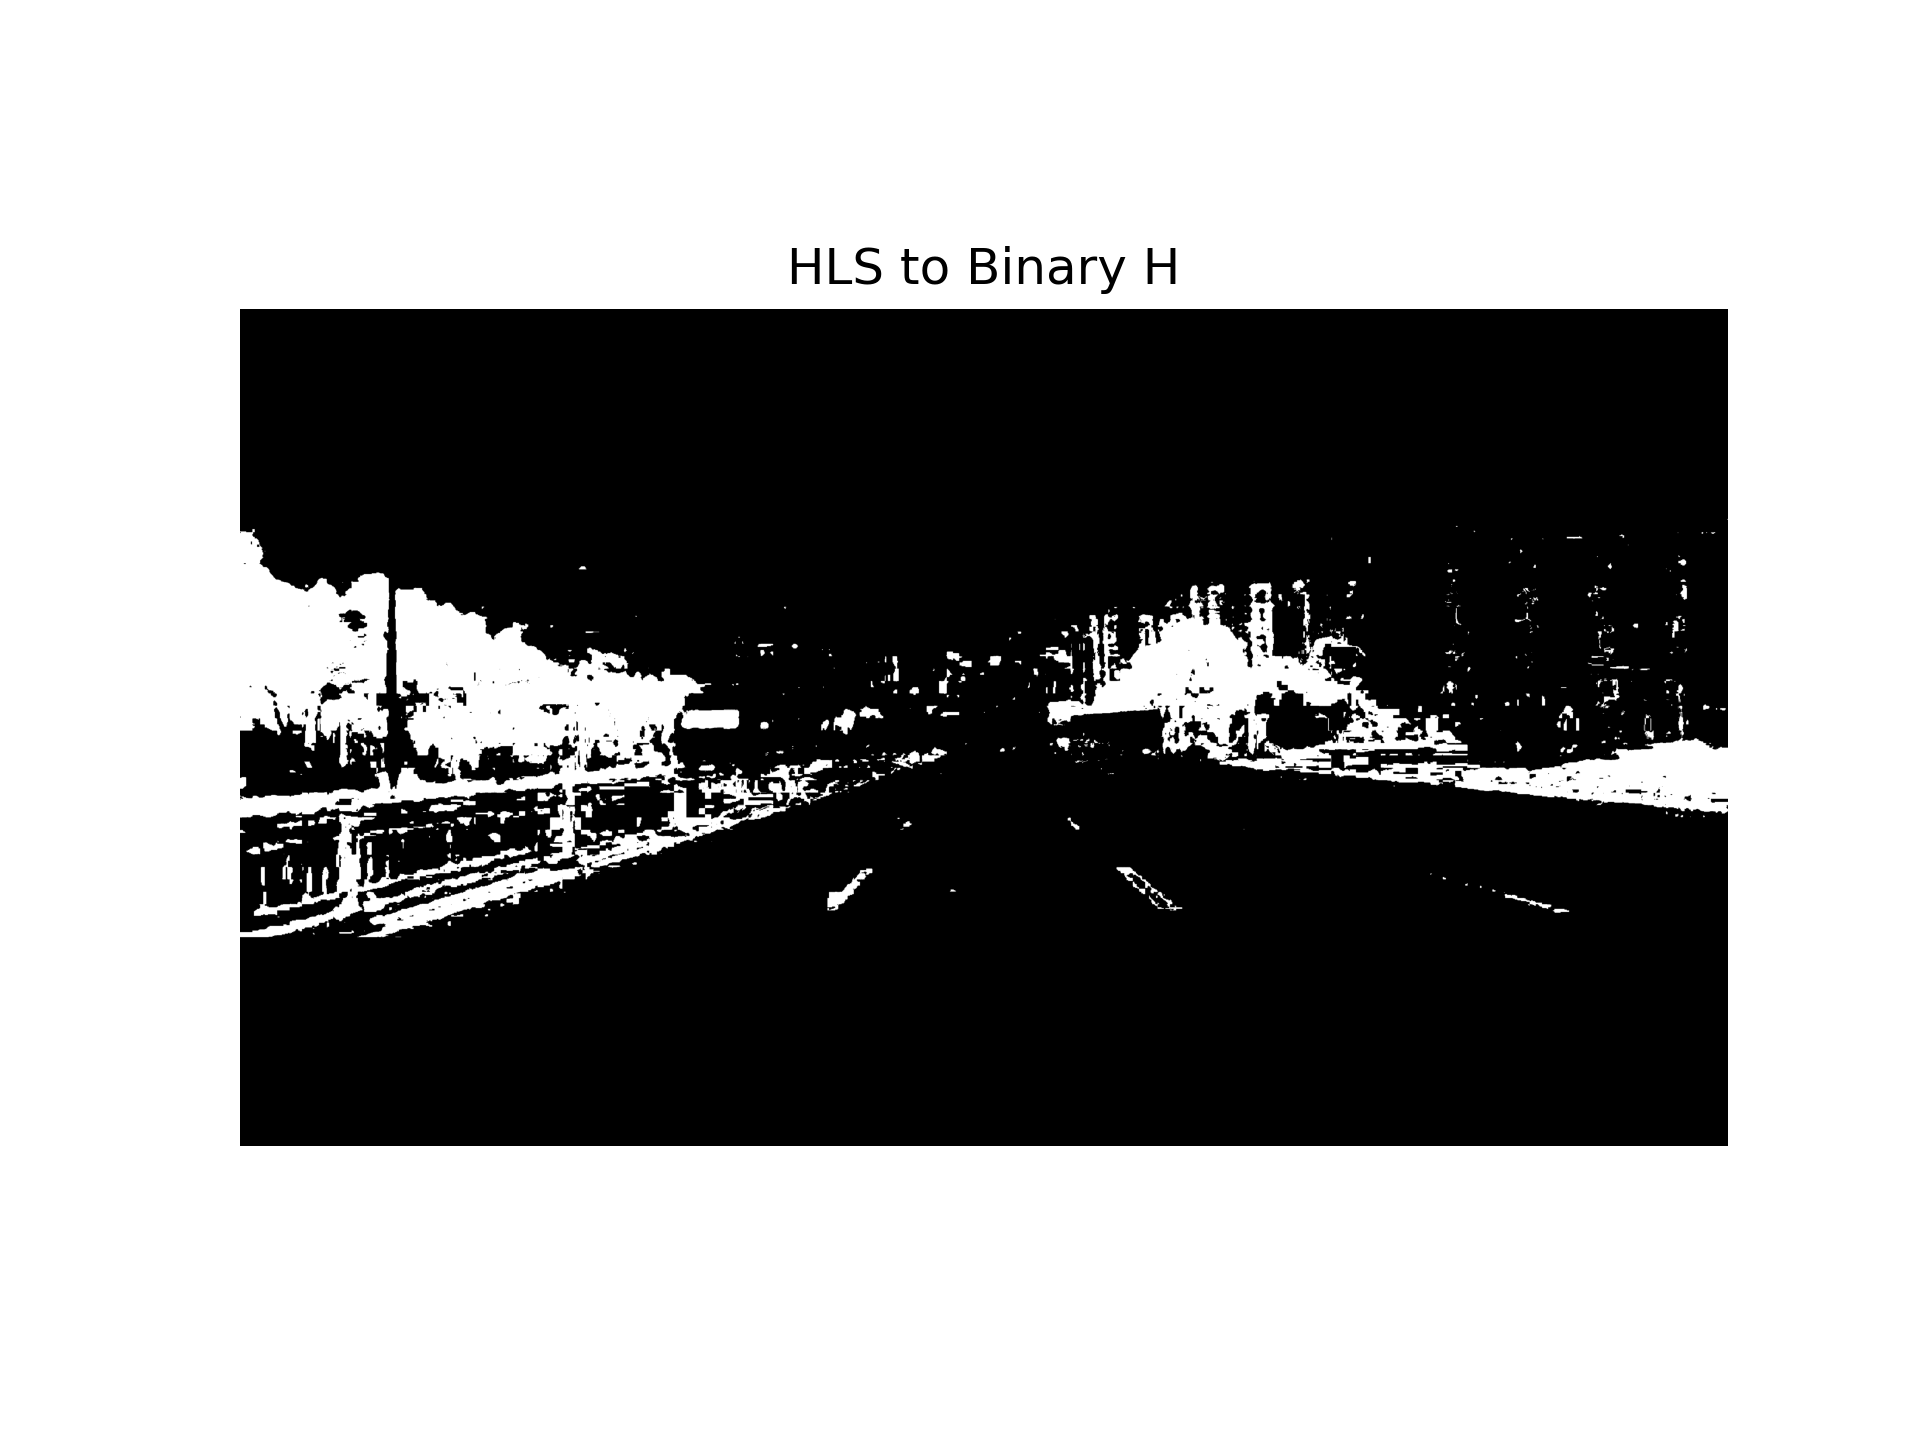
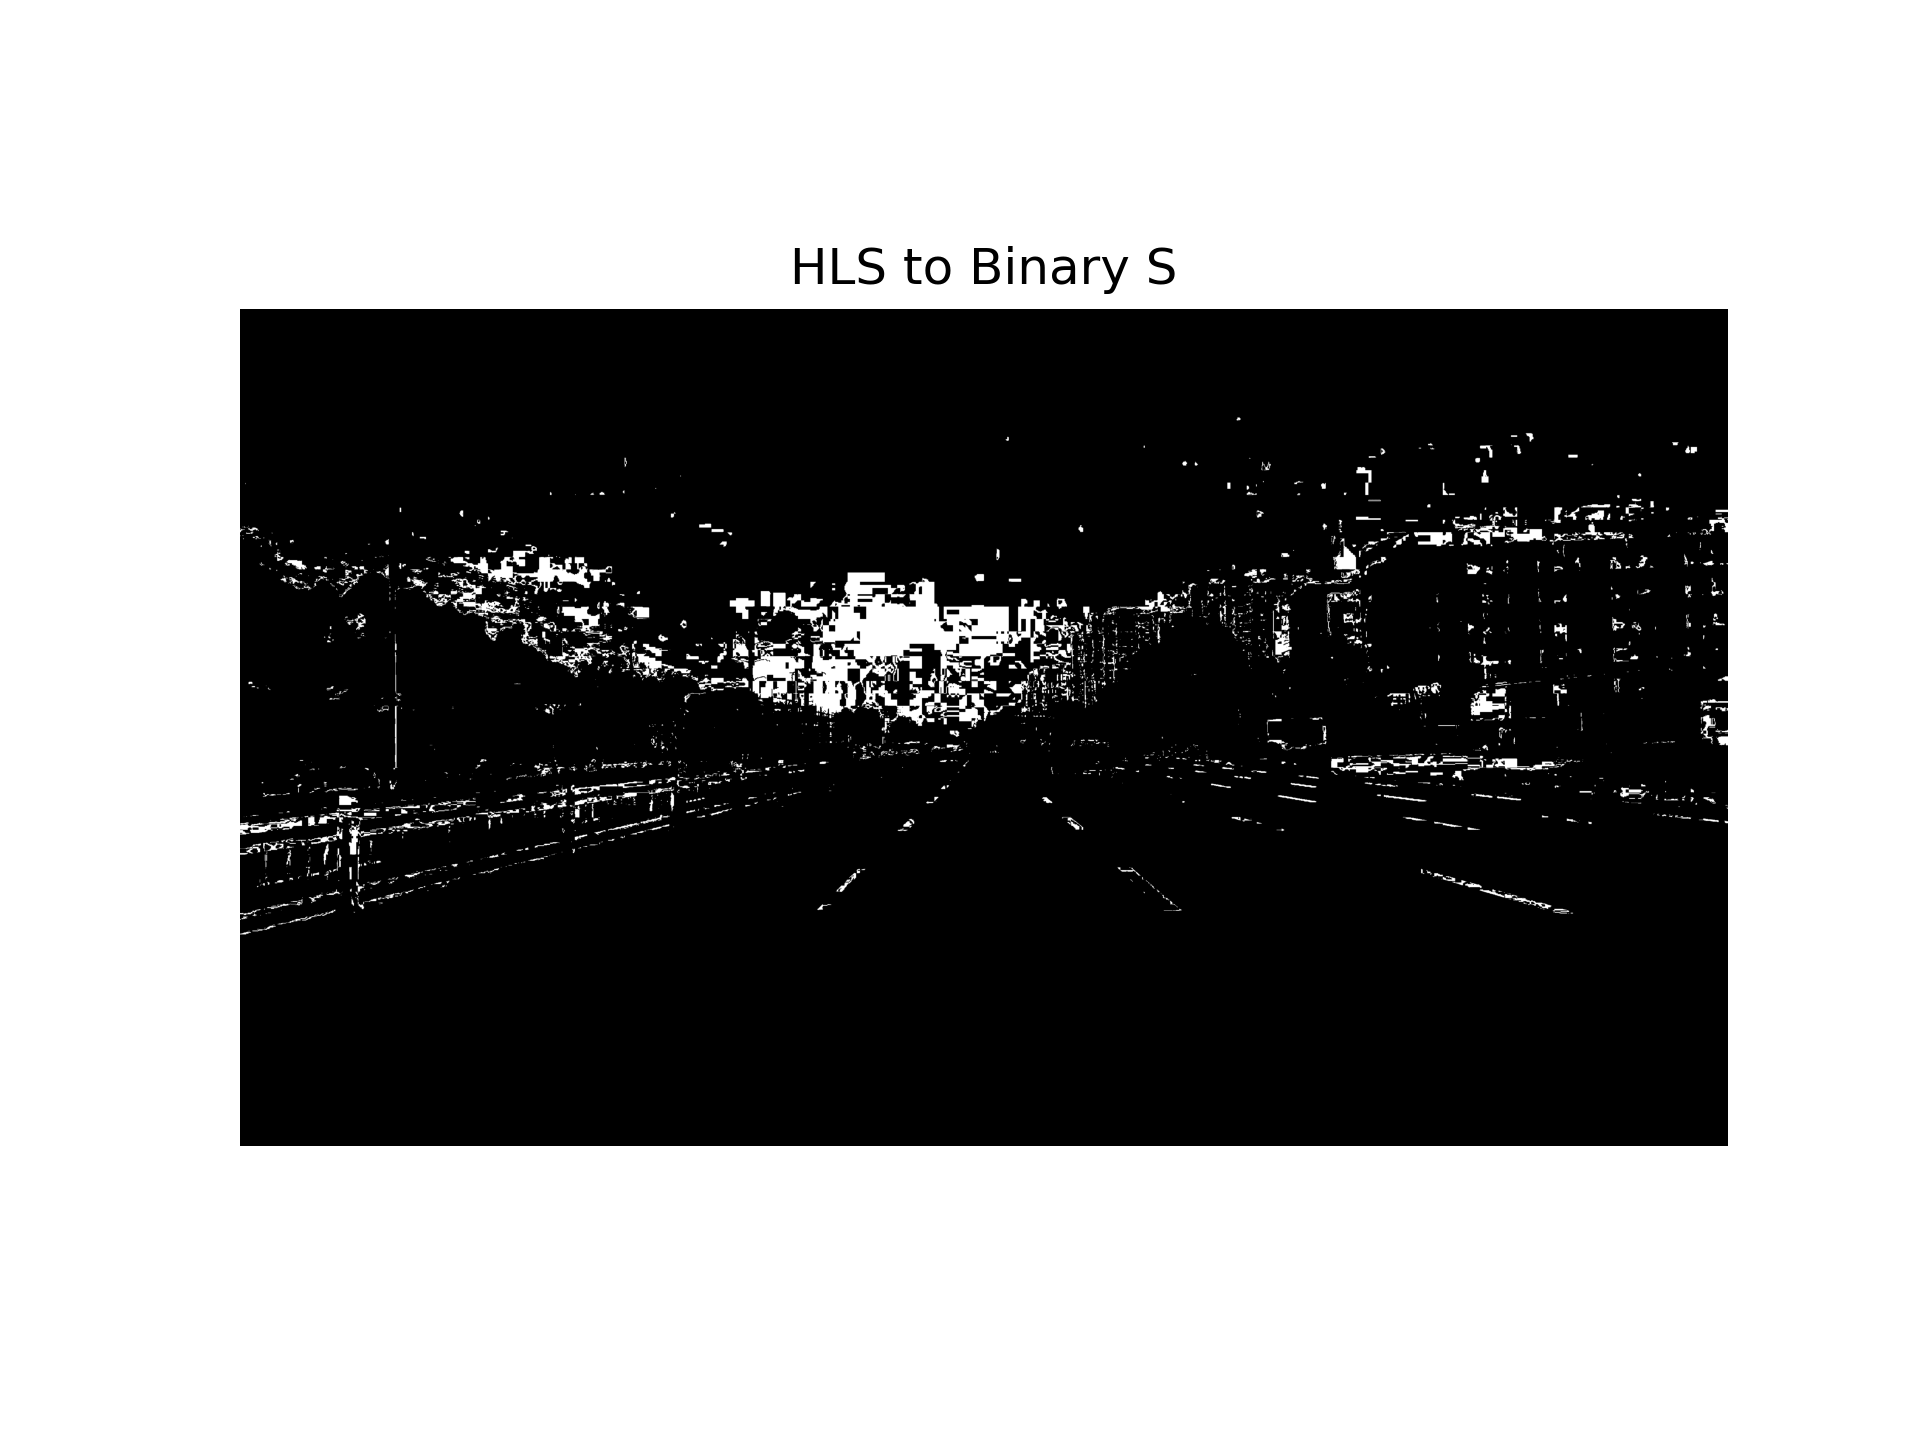
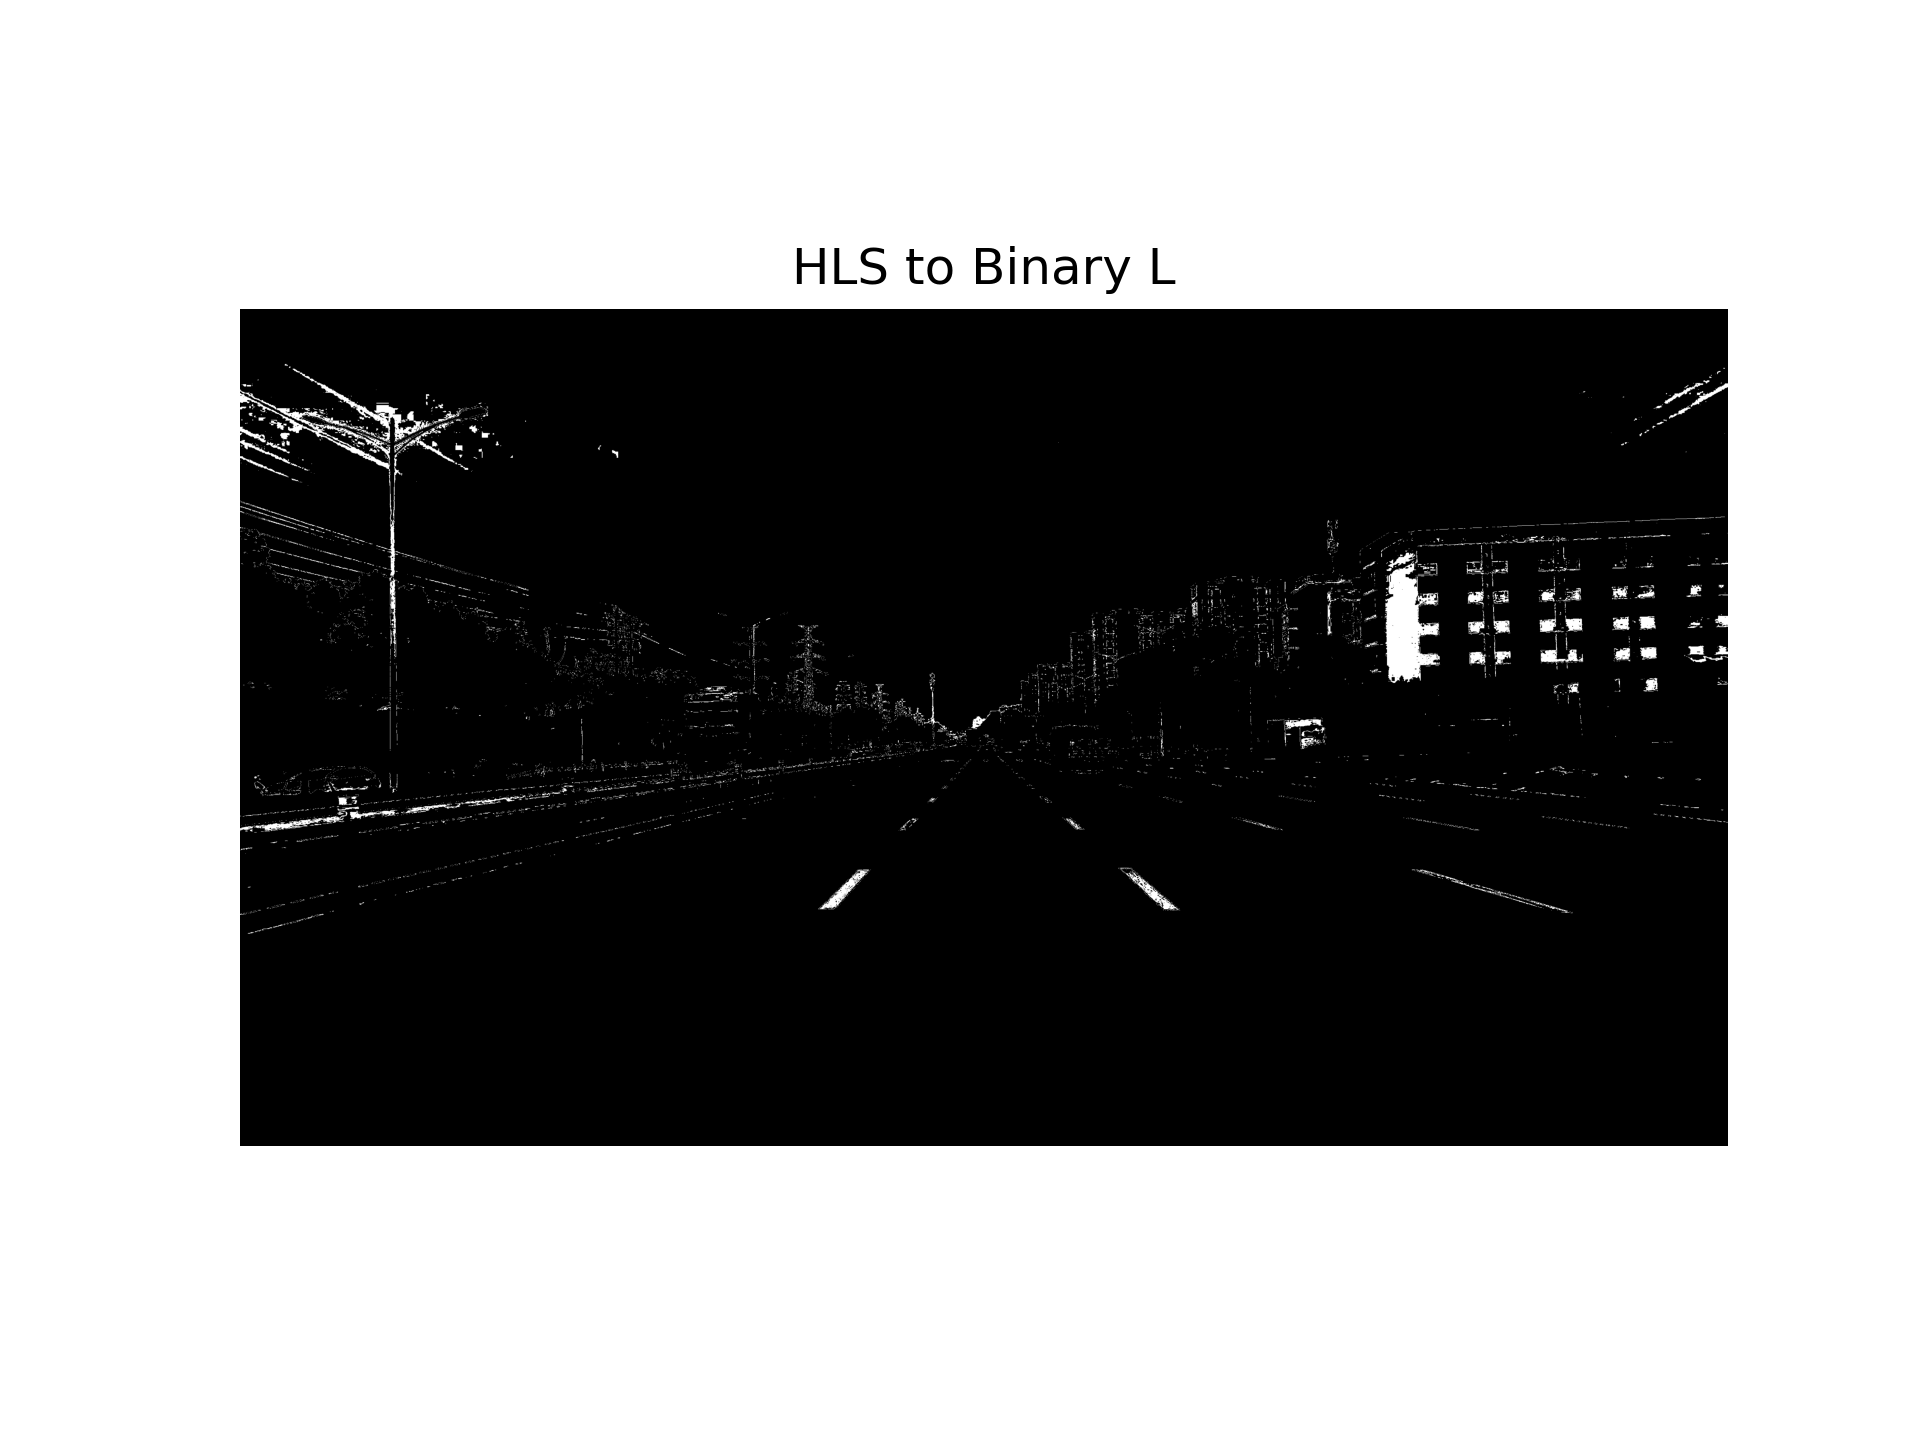
2.HSL通道转换以及二值化
    if dst_format == 'HSV':
        converted = cv2.cvtColor(img, cv2.COLOR_RGB2HSV)
    else:
        converted = cv2.cvtColor(img, cv2.COLOR_RGB2HLS)
    channel_idx = int(ch - 1)
    channel_img = converted[:, :, channel_idx]
    binary_full = np.zeros_like(channel_img)
    binary_full[(channel_img >= ch_thresh[0]) & (channel_img <= ch_thresh[1])] = 1
    if roi_vertices is None:
        return binary_full
    mask = np.zeros_like(channel_img)
    cv2.fillPoly(mask, roi_vertices, 1)  # ROI 内填充为 1
    binary_roi = cv2.bitwise_and(binary_full, mask)
    return binary_roi
三个通道的二值化结果:
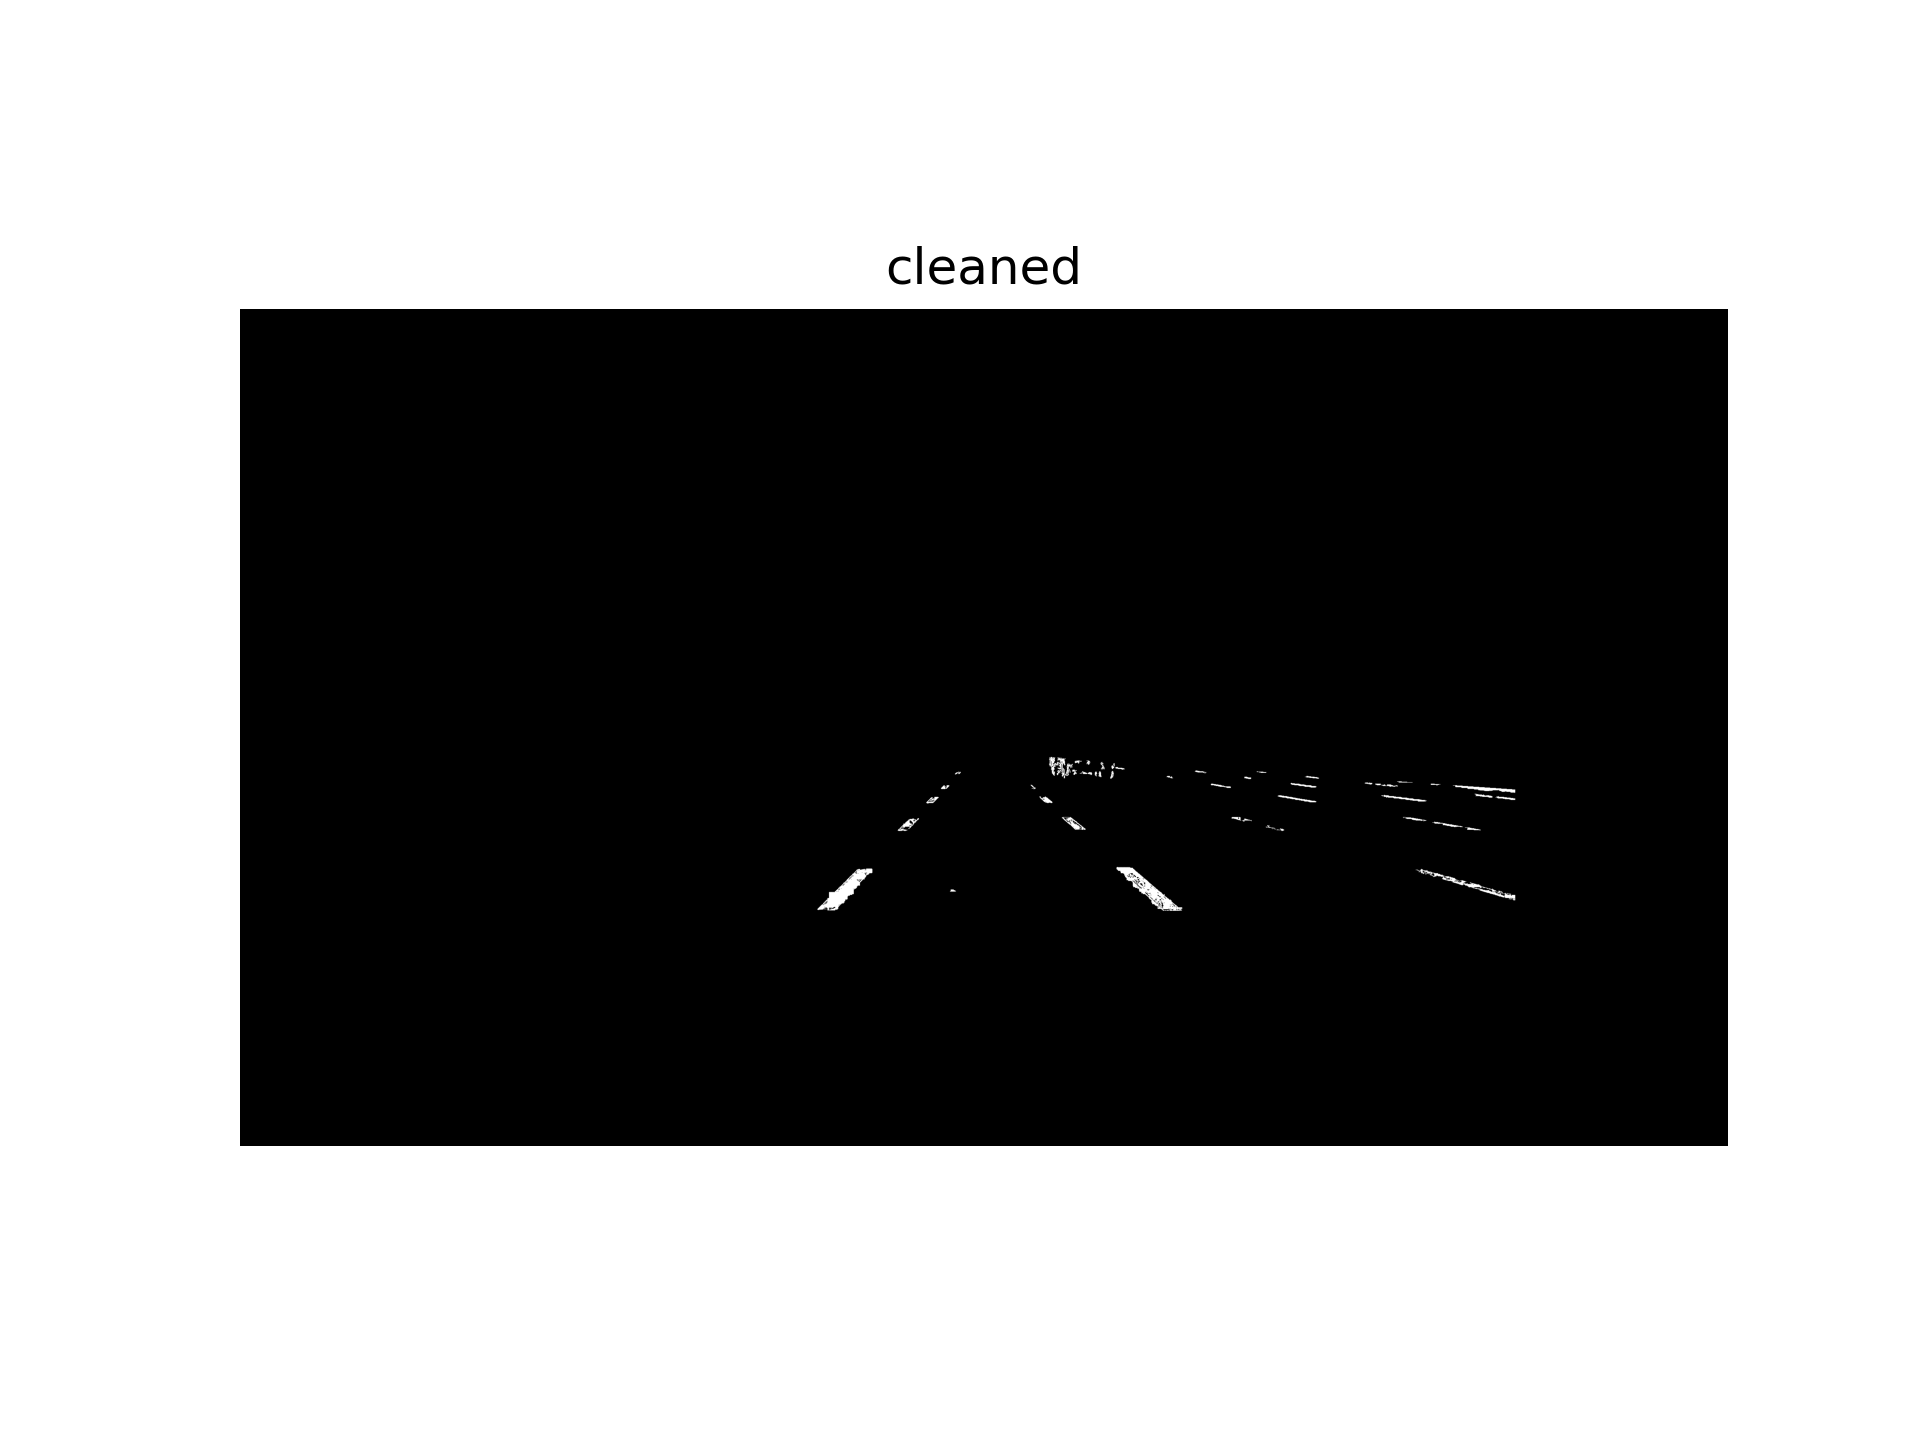
将上一步sobel提取的图与这三张图做并集,使得车道线更清晰;设置掩码区域,把无关区域变黑:
binary[(ch1_hls_binary==1)|(ch2_hls_binary==1)|(ch3_hls_binary==1)] = 1
combined_output[((gradx==1)|(binary==1))] = 1


mask = np.zeros_like(combined_output)
vertices = np.array([[
    [1260, 1620],   # 左下
    [1862, 1140],   # 左上
    [3290, 1240],  # 右上
    [3290, 1620]   # 右下
]], dtype=np.int32)
cv2.fillPoly(mask,vertices,1)
masked_image = cv2.bitwise_and(combined_output,mask)
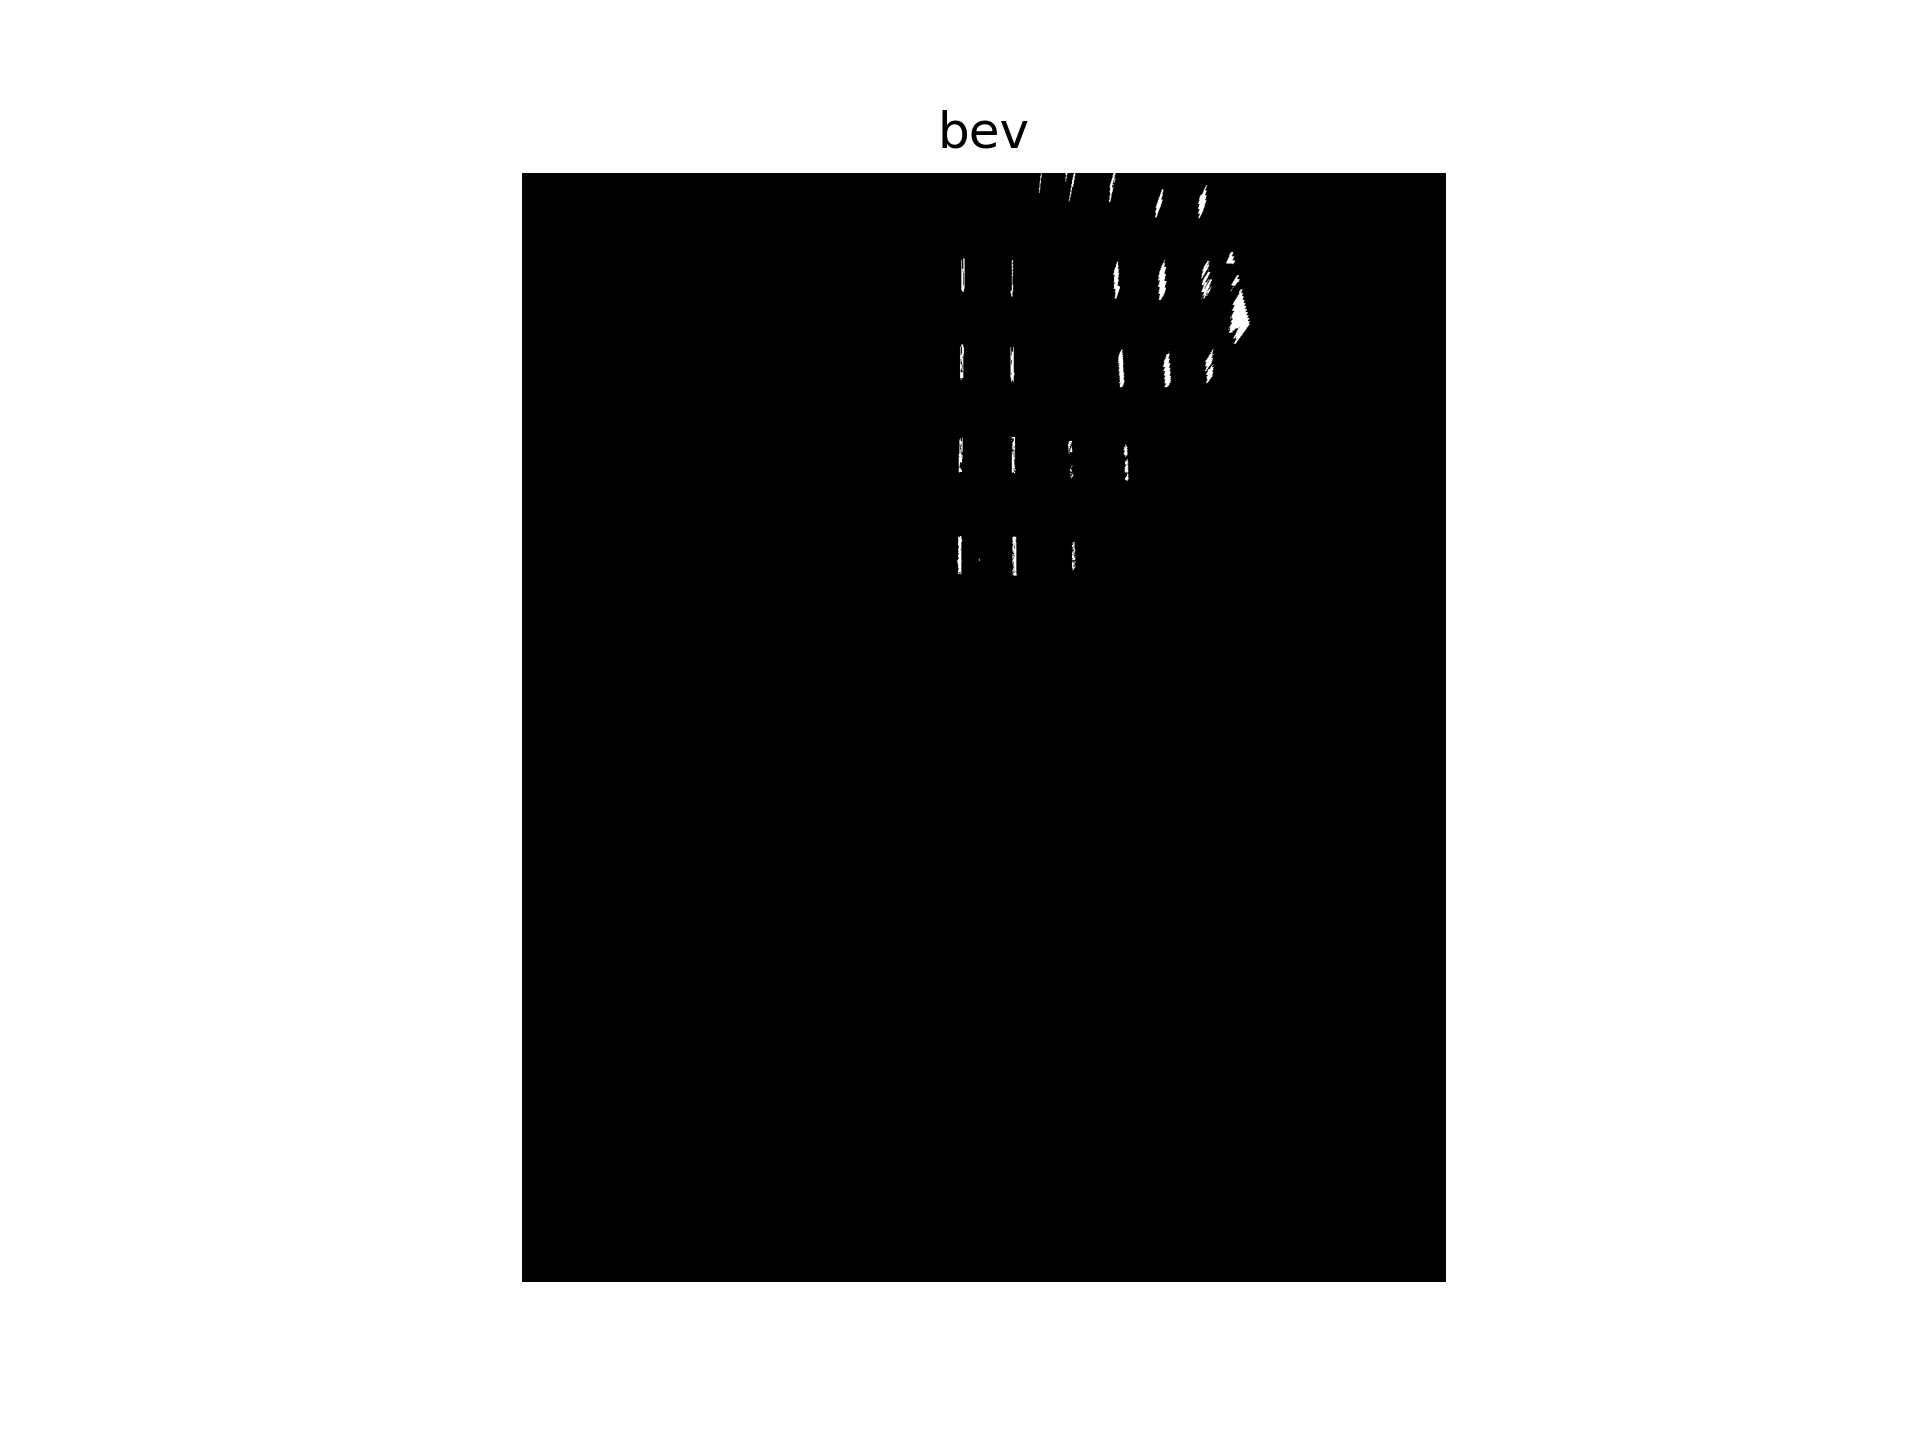
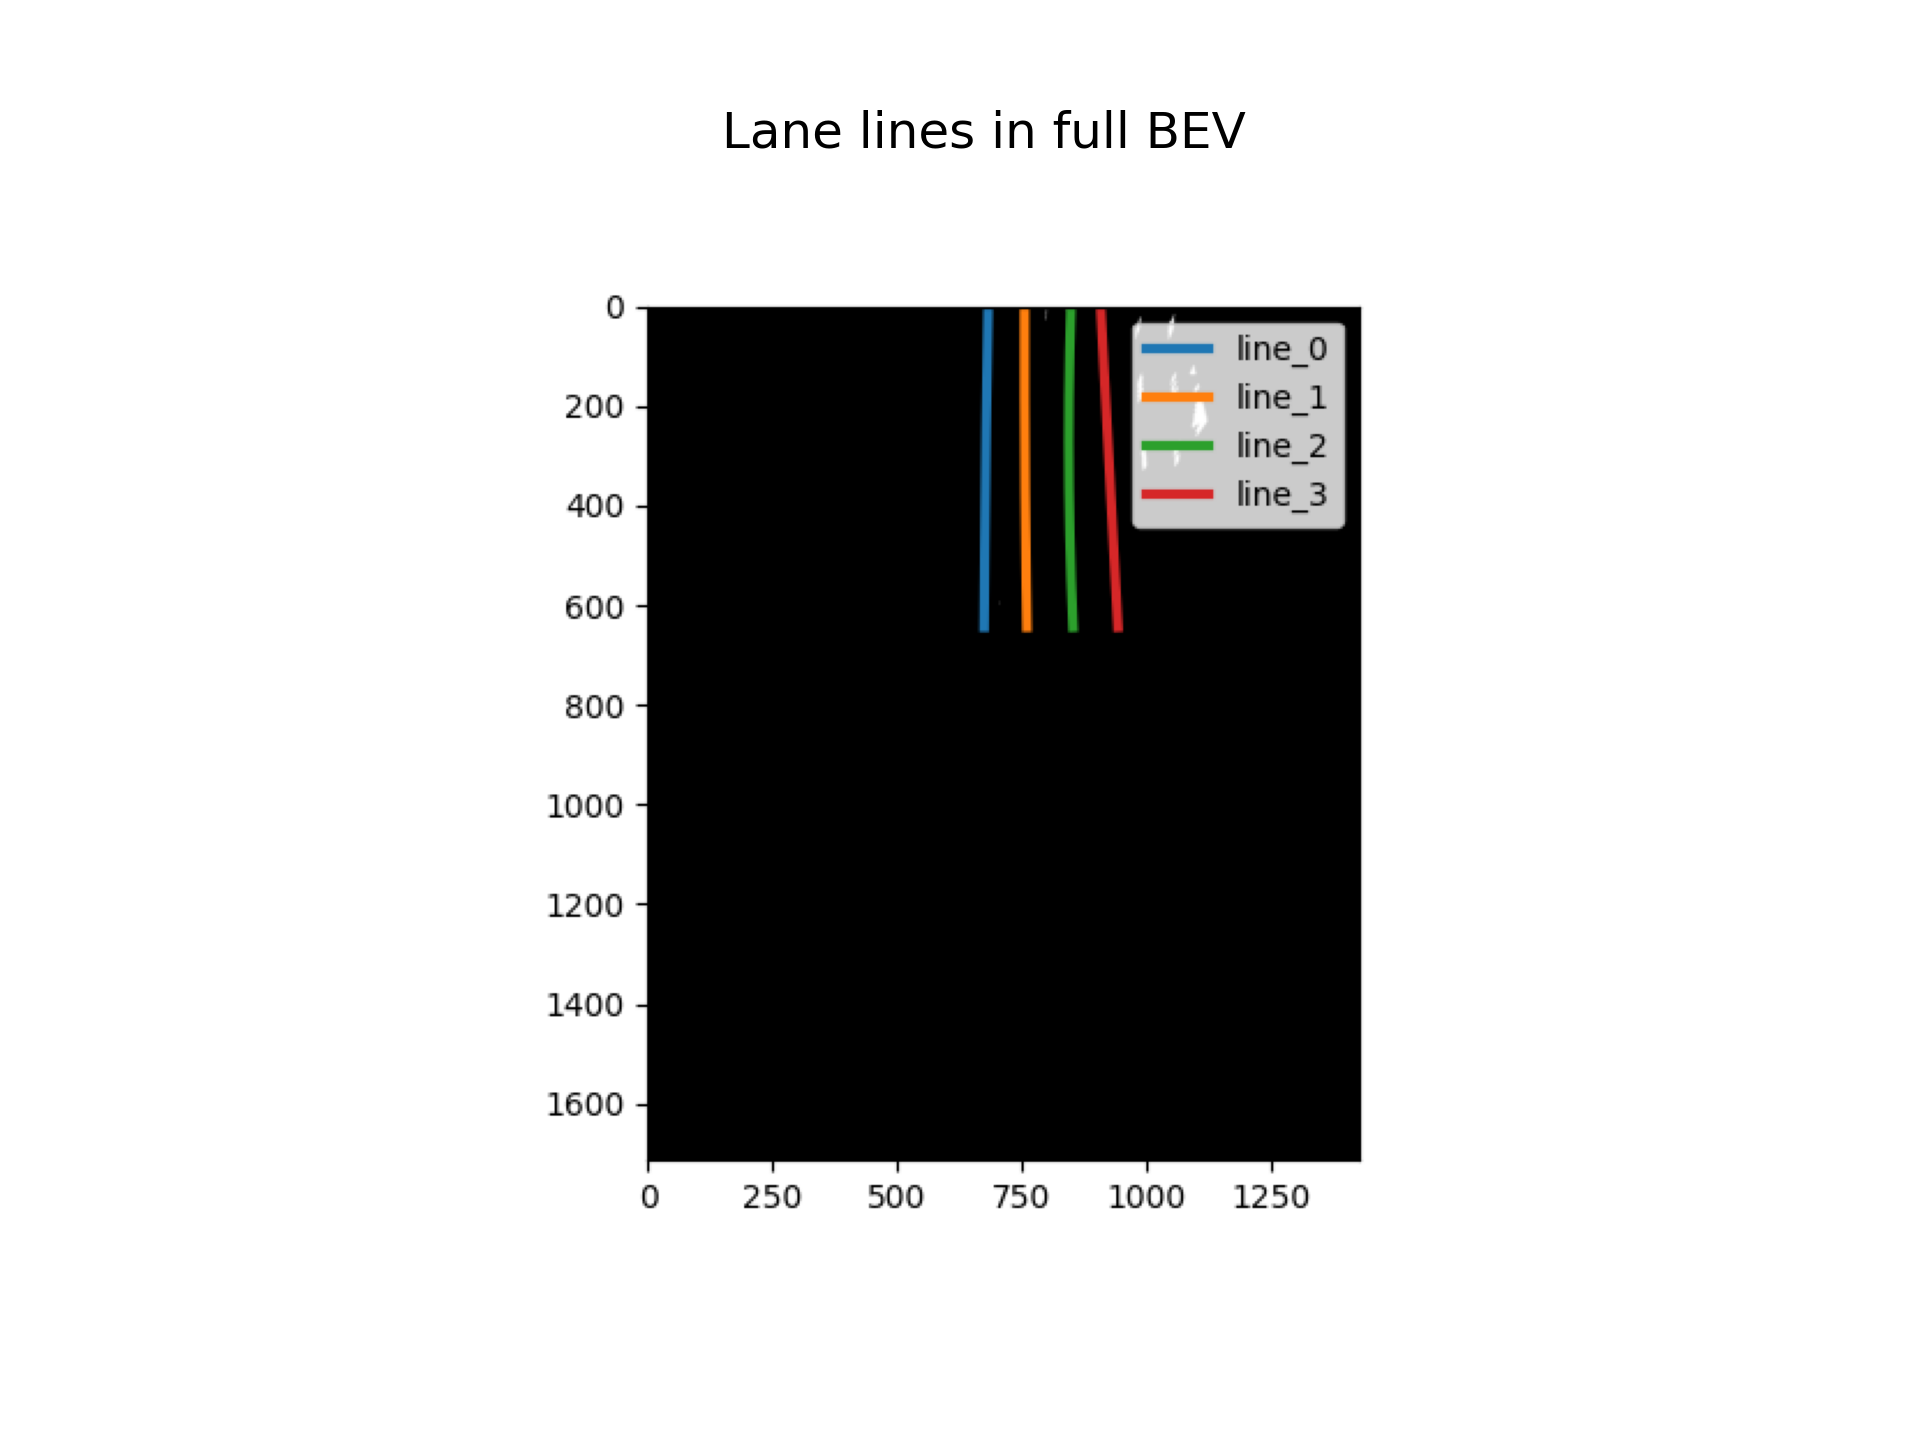
3.bev变换以及ROI选定
把刚刚的图片利用相机标定完的内外参,进行ipm透视变换,获得bev,并进行裁切。
K = np.array([
[1911.04341521,0,1921.22219603],
[0,1911.04341521,1080.95481933],
[0,0,1]
], dtype=np.float64)

rvec = np.array([-1.193537833978977, 1.203022796612023, -1.211087909882188], dtype=np.float64)
tvec = np.array([1.861907890121326, -0.031449792916173, 1.483806352798730], dtype=np.float64)

bev, perspective_matrix = img_to_bev([K,rvec,tvec], cleaned,
                    pix_size=0.035,
                    world_width = 50,
                    world_height = 60,
                    camera_position= "all")
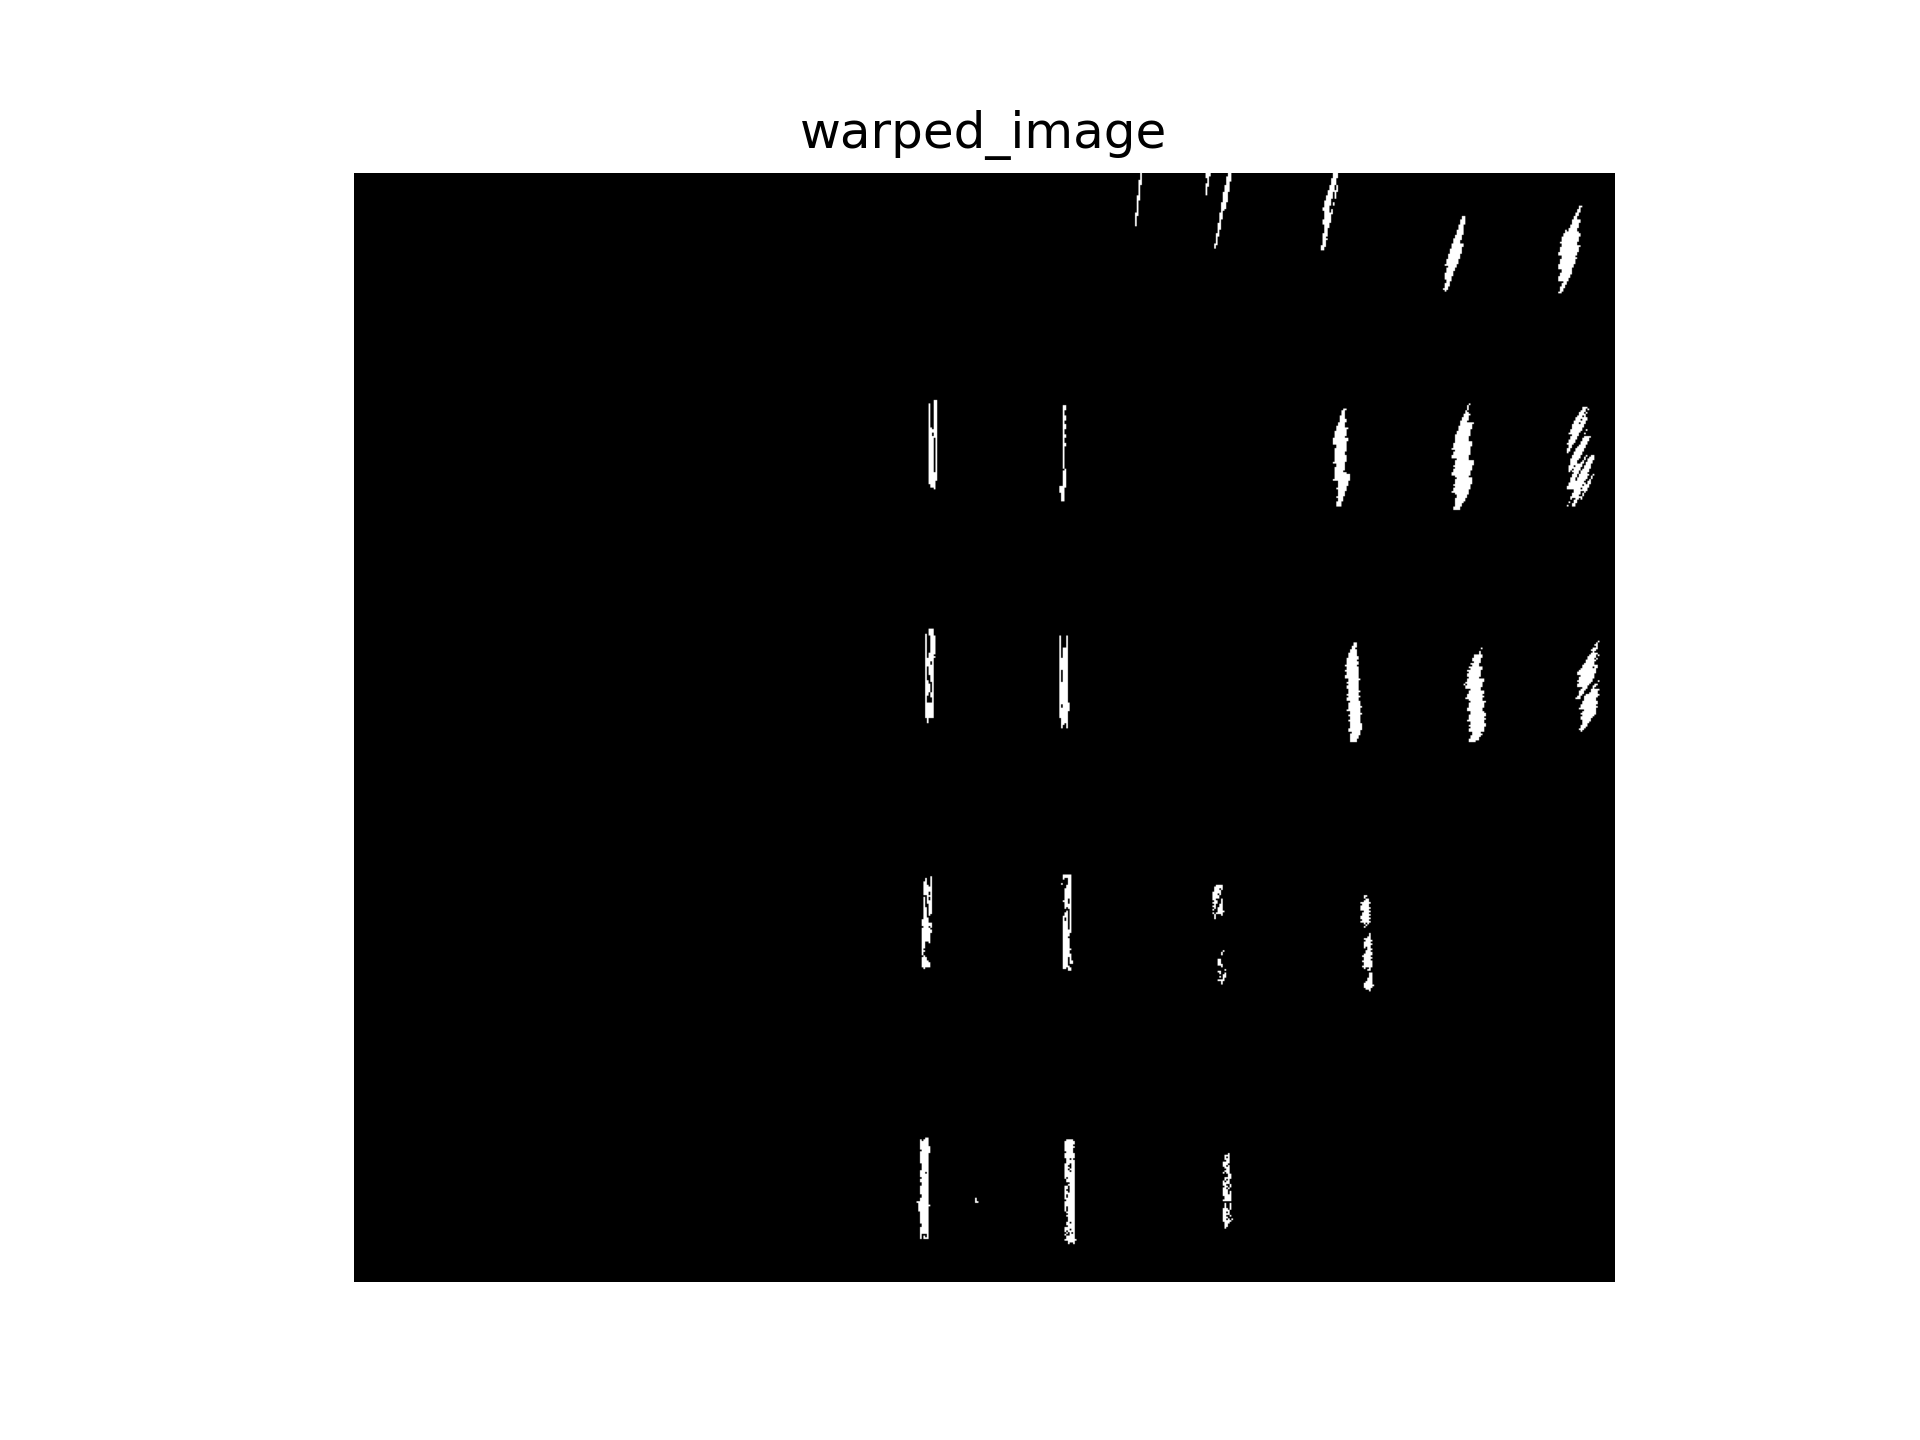
4.车道线检测
先寻找直方图的峰值:
def find_all_starter_centroids(image, peak_thresh=10, min_dist=50):

    histogram = np.sum(image[image.shape[0]//2:,:], axis=0)

    peaks = []

    for i in range(1,len(histogram)-1):
        if histogram[i] > histogram[i-1] and histogram[i] > histogram[i+1]:
            if histogram[i] > peak_thresh:
                peaks.append(i)

    # 合并太近的峰
    filtered = []
    for p in peaks:
        if len(filtered)==0 or abs(p-filtered[-1])>min_dist:
            filtered.append(p)

    return filtered
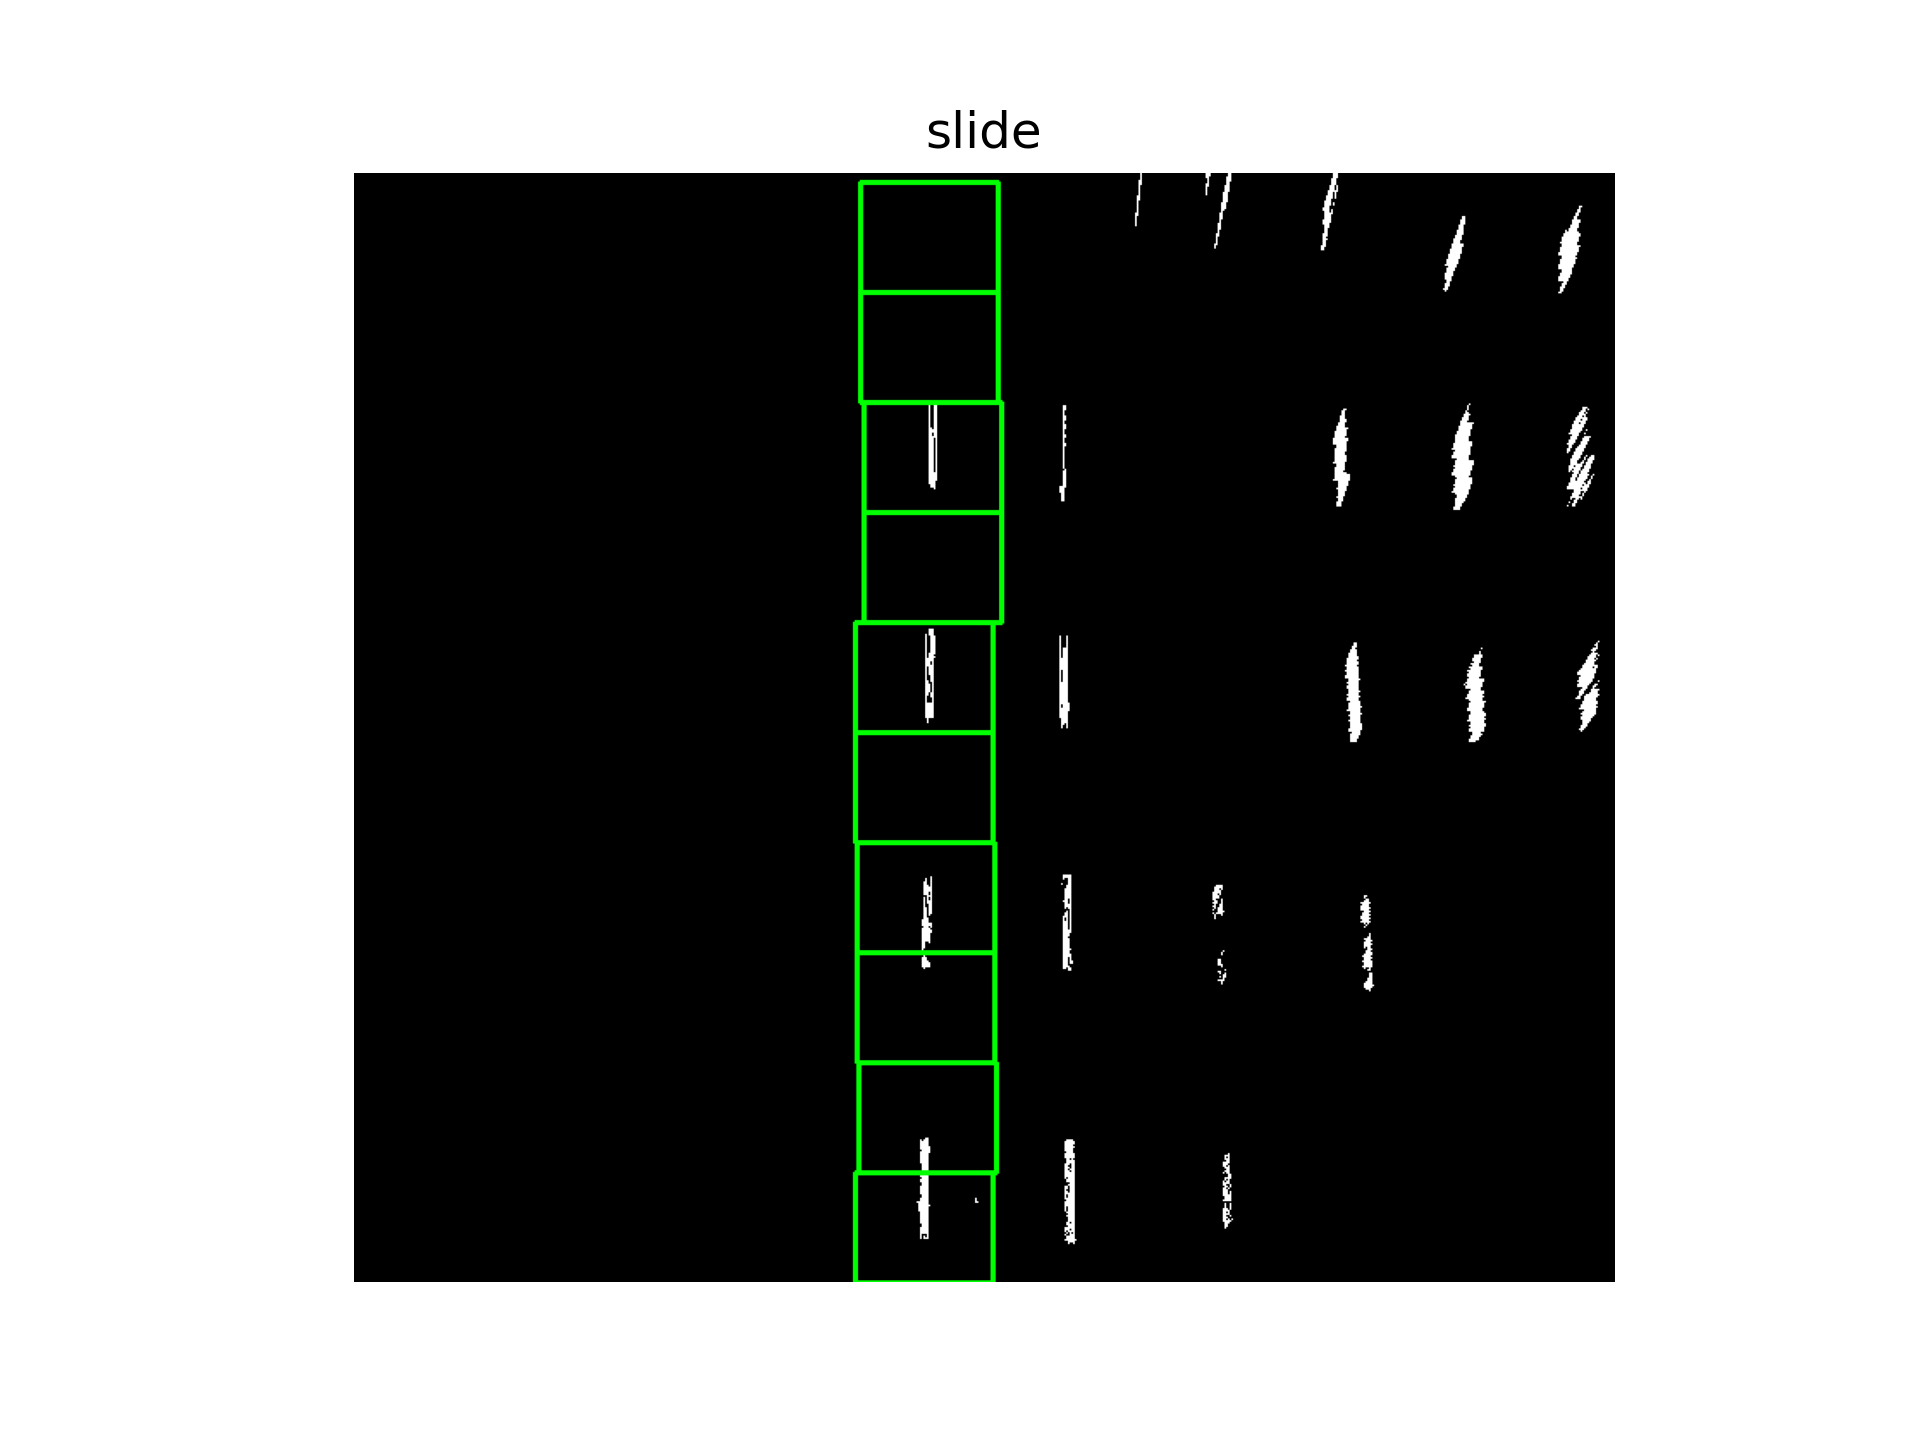
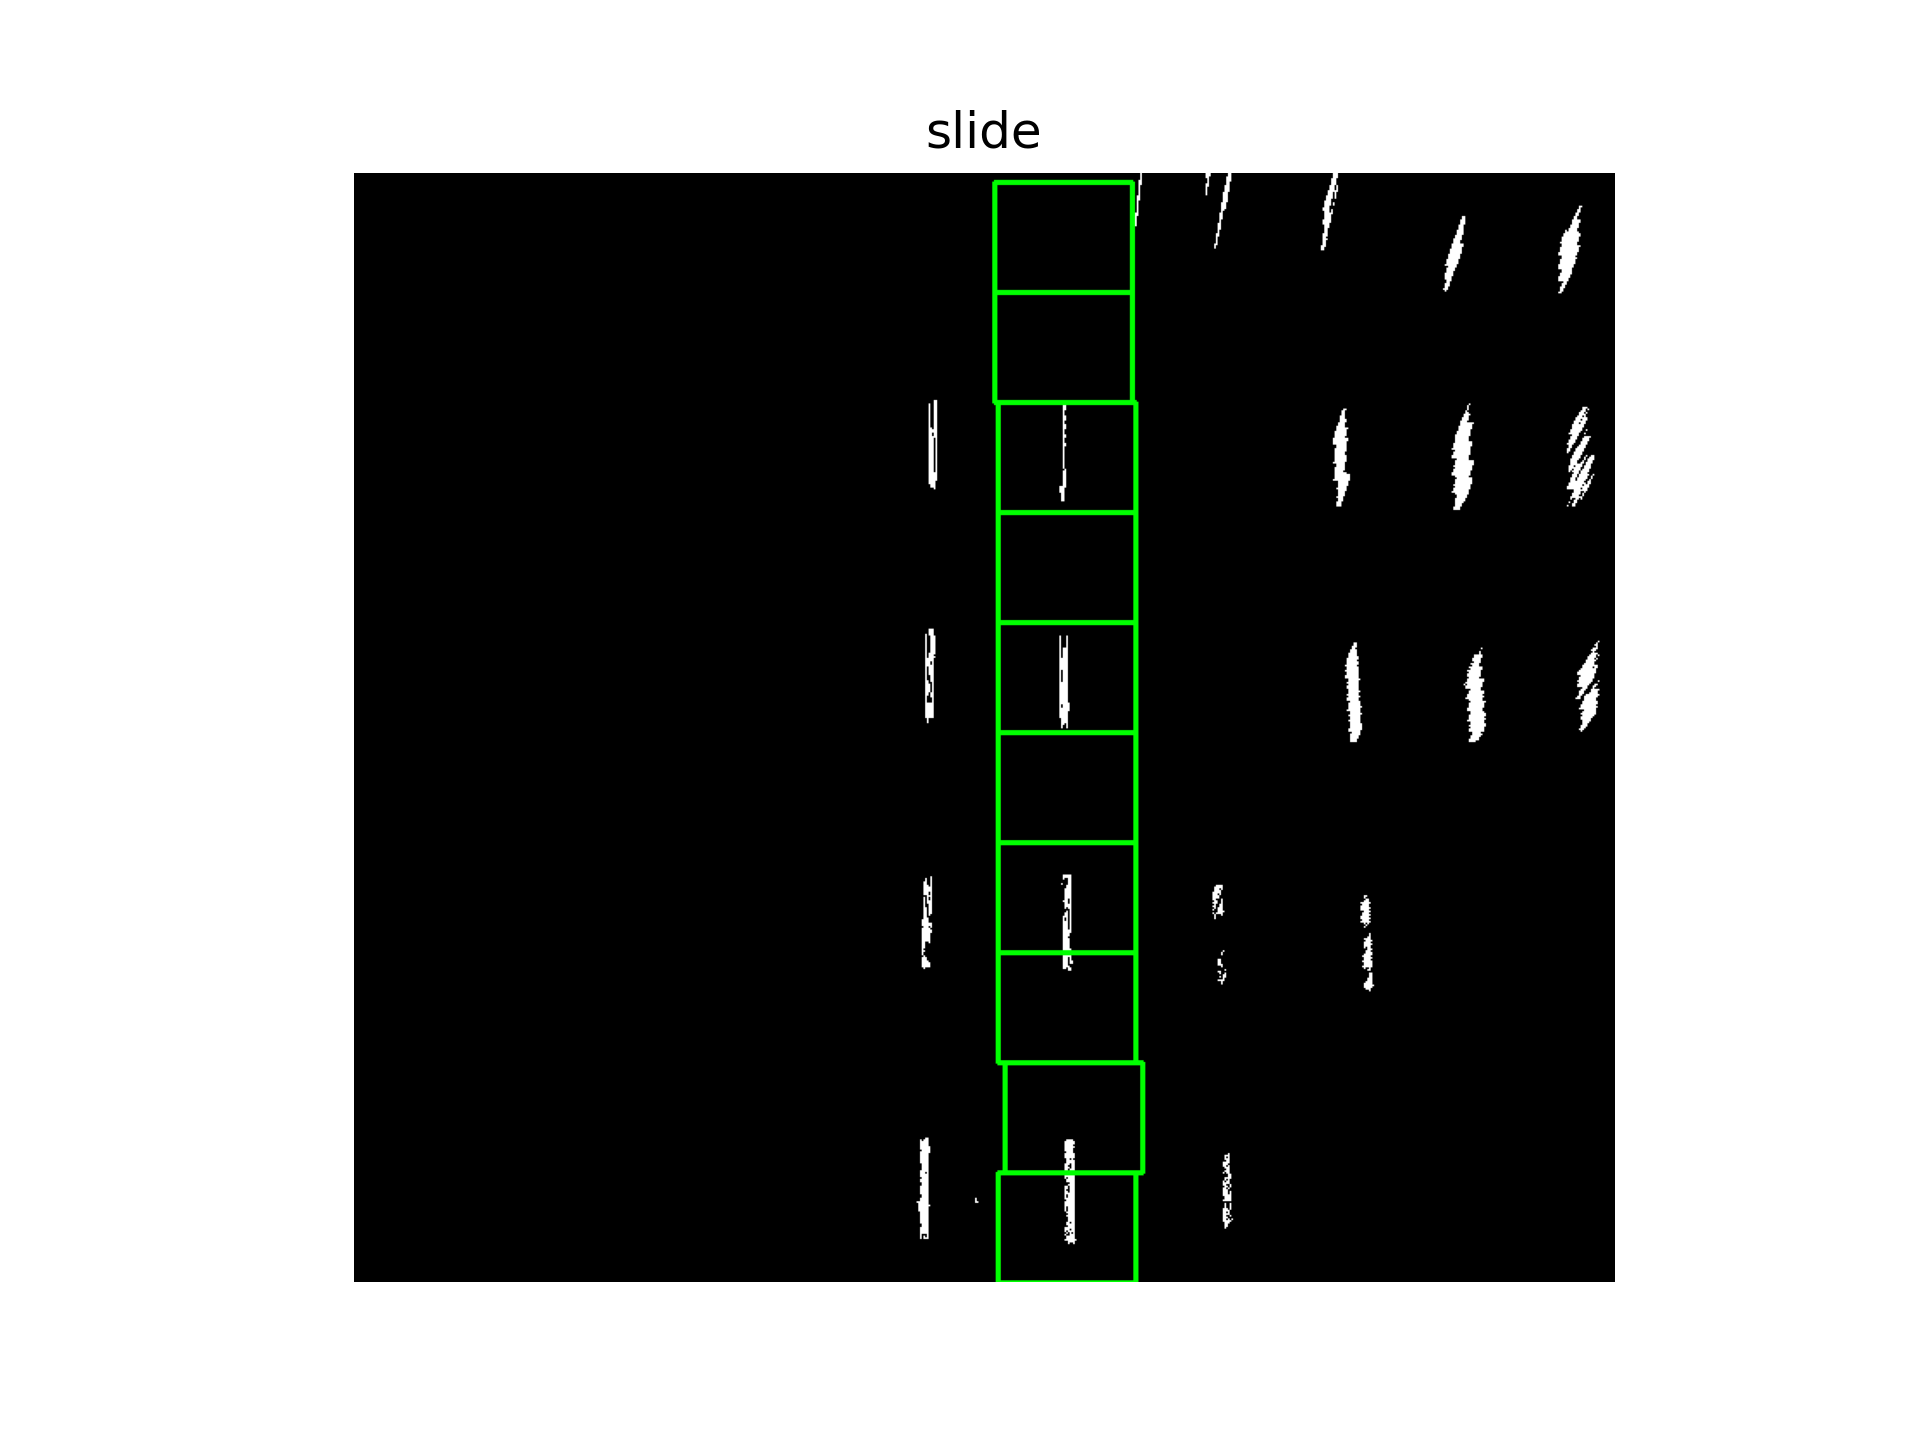
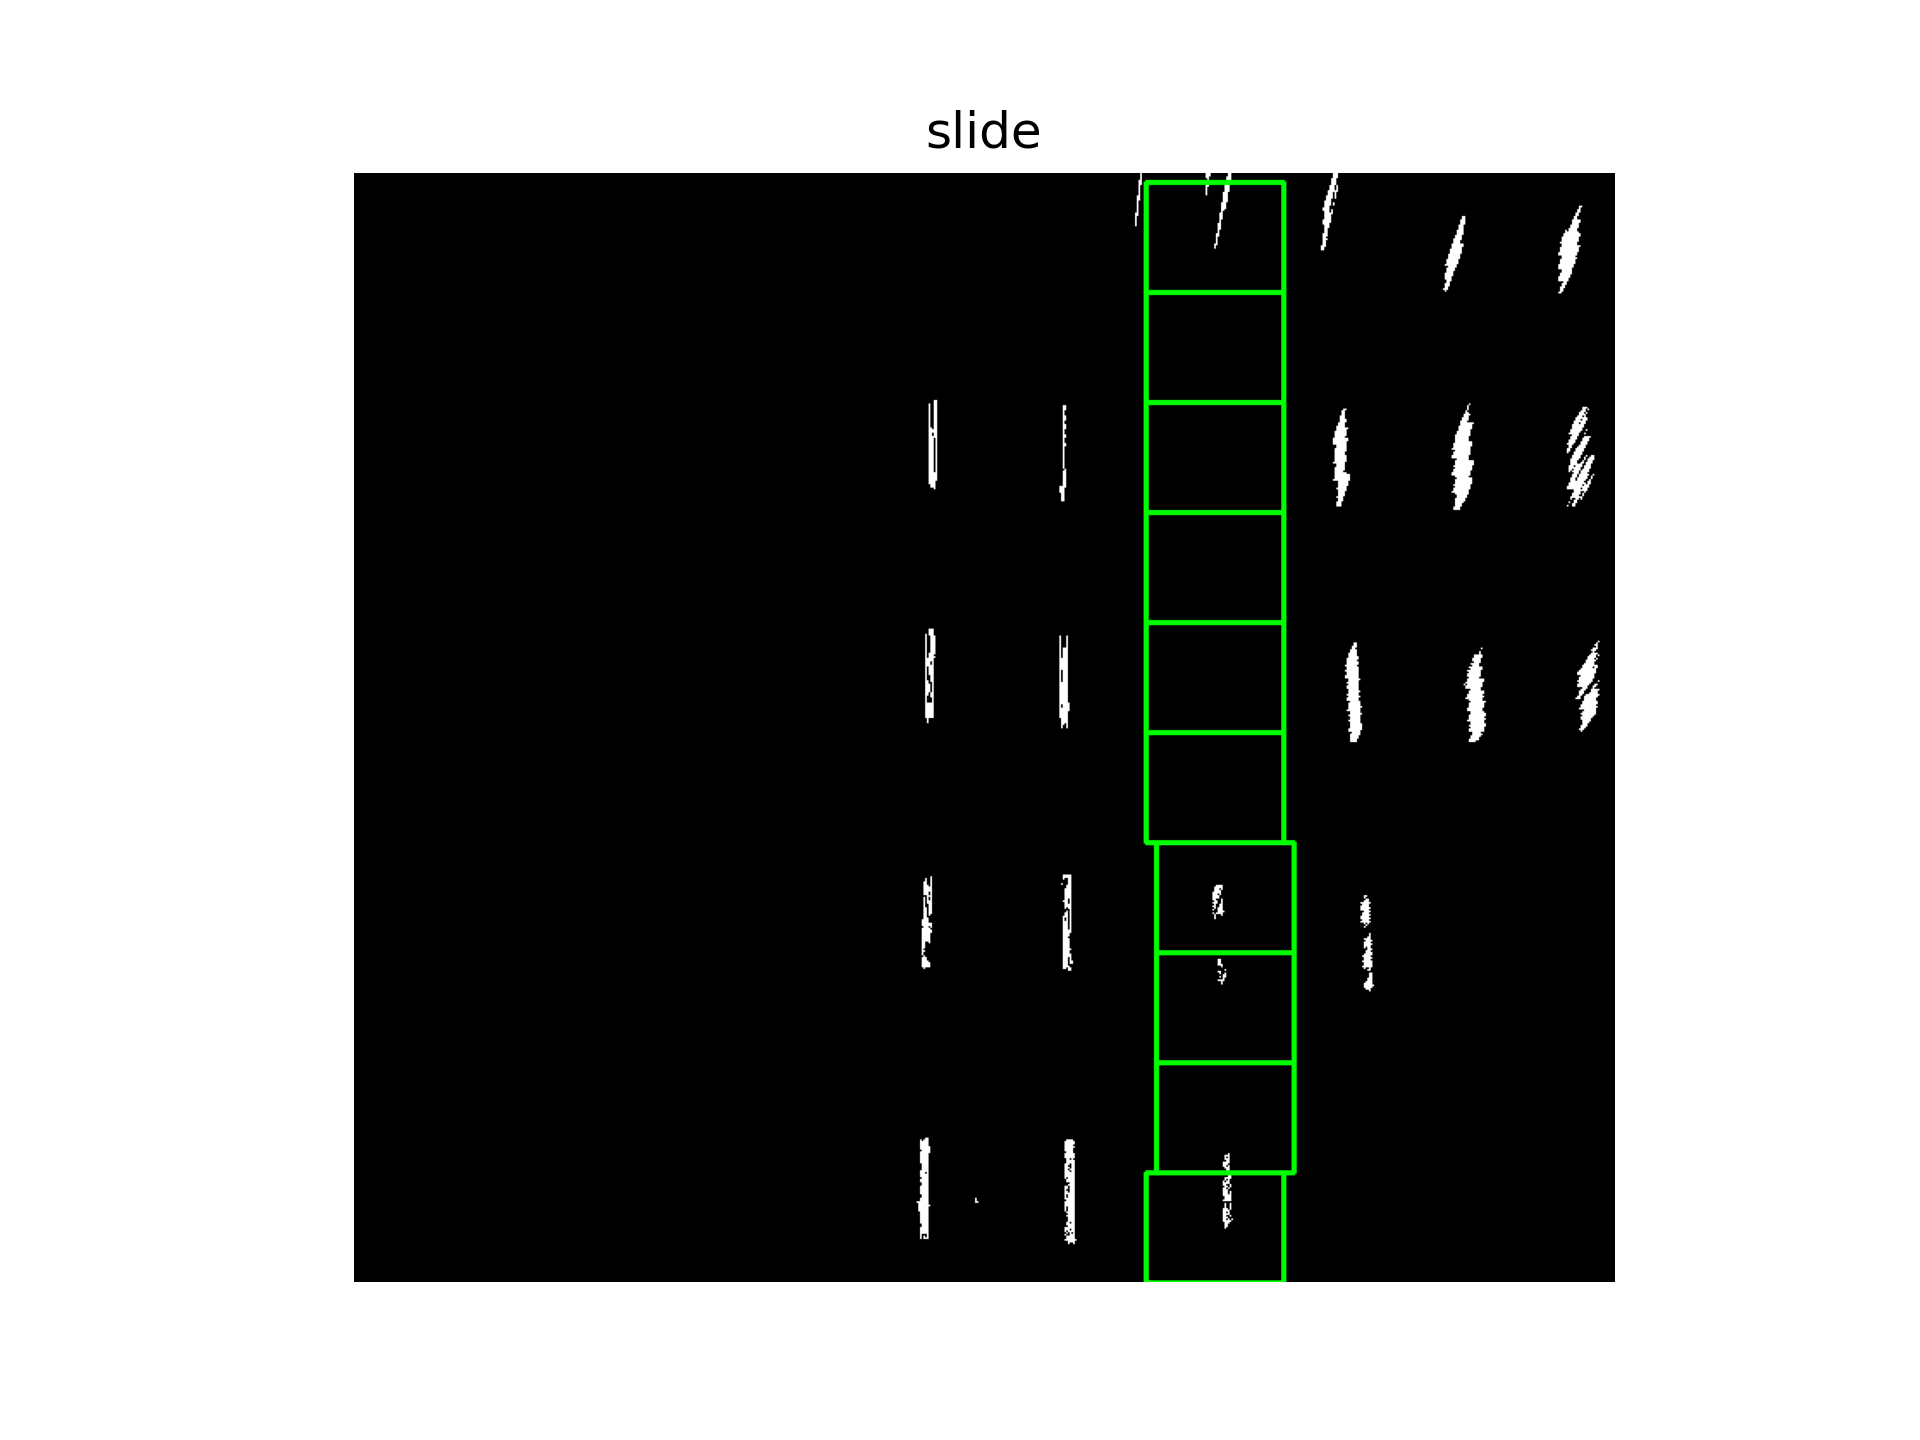
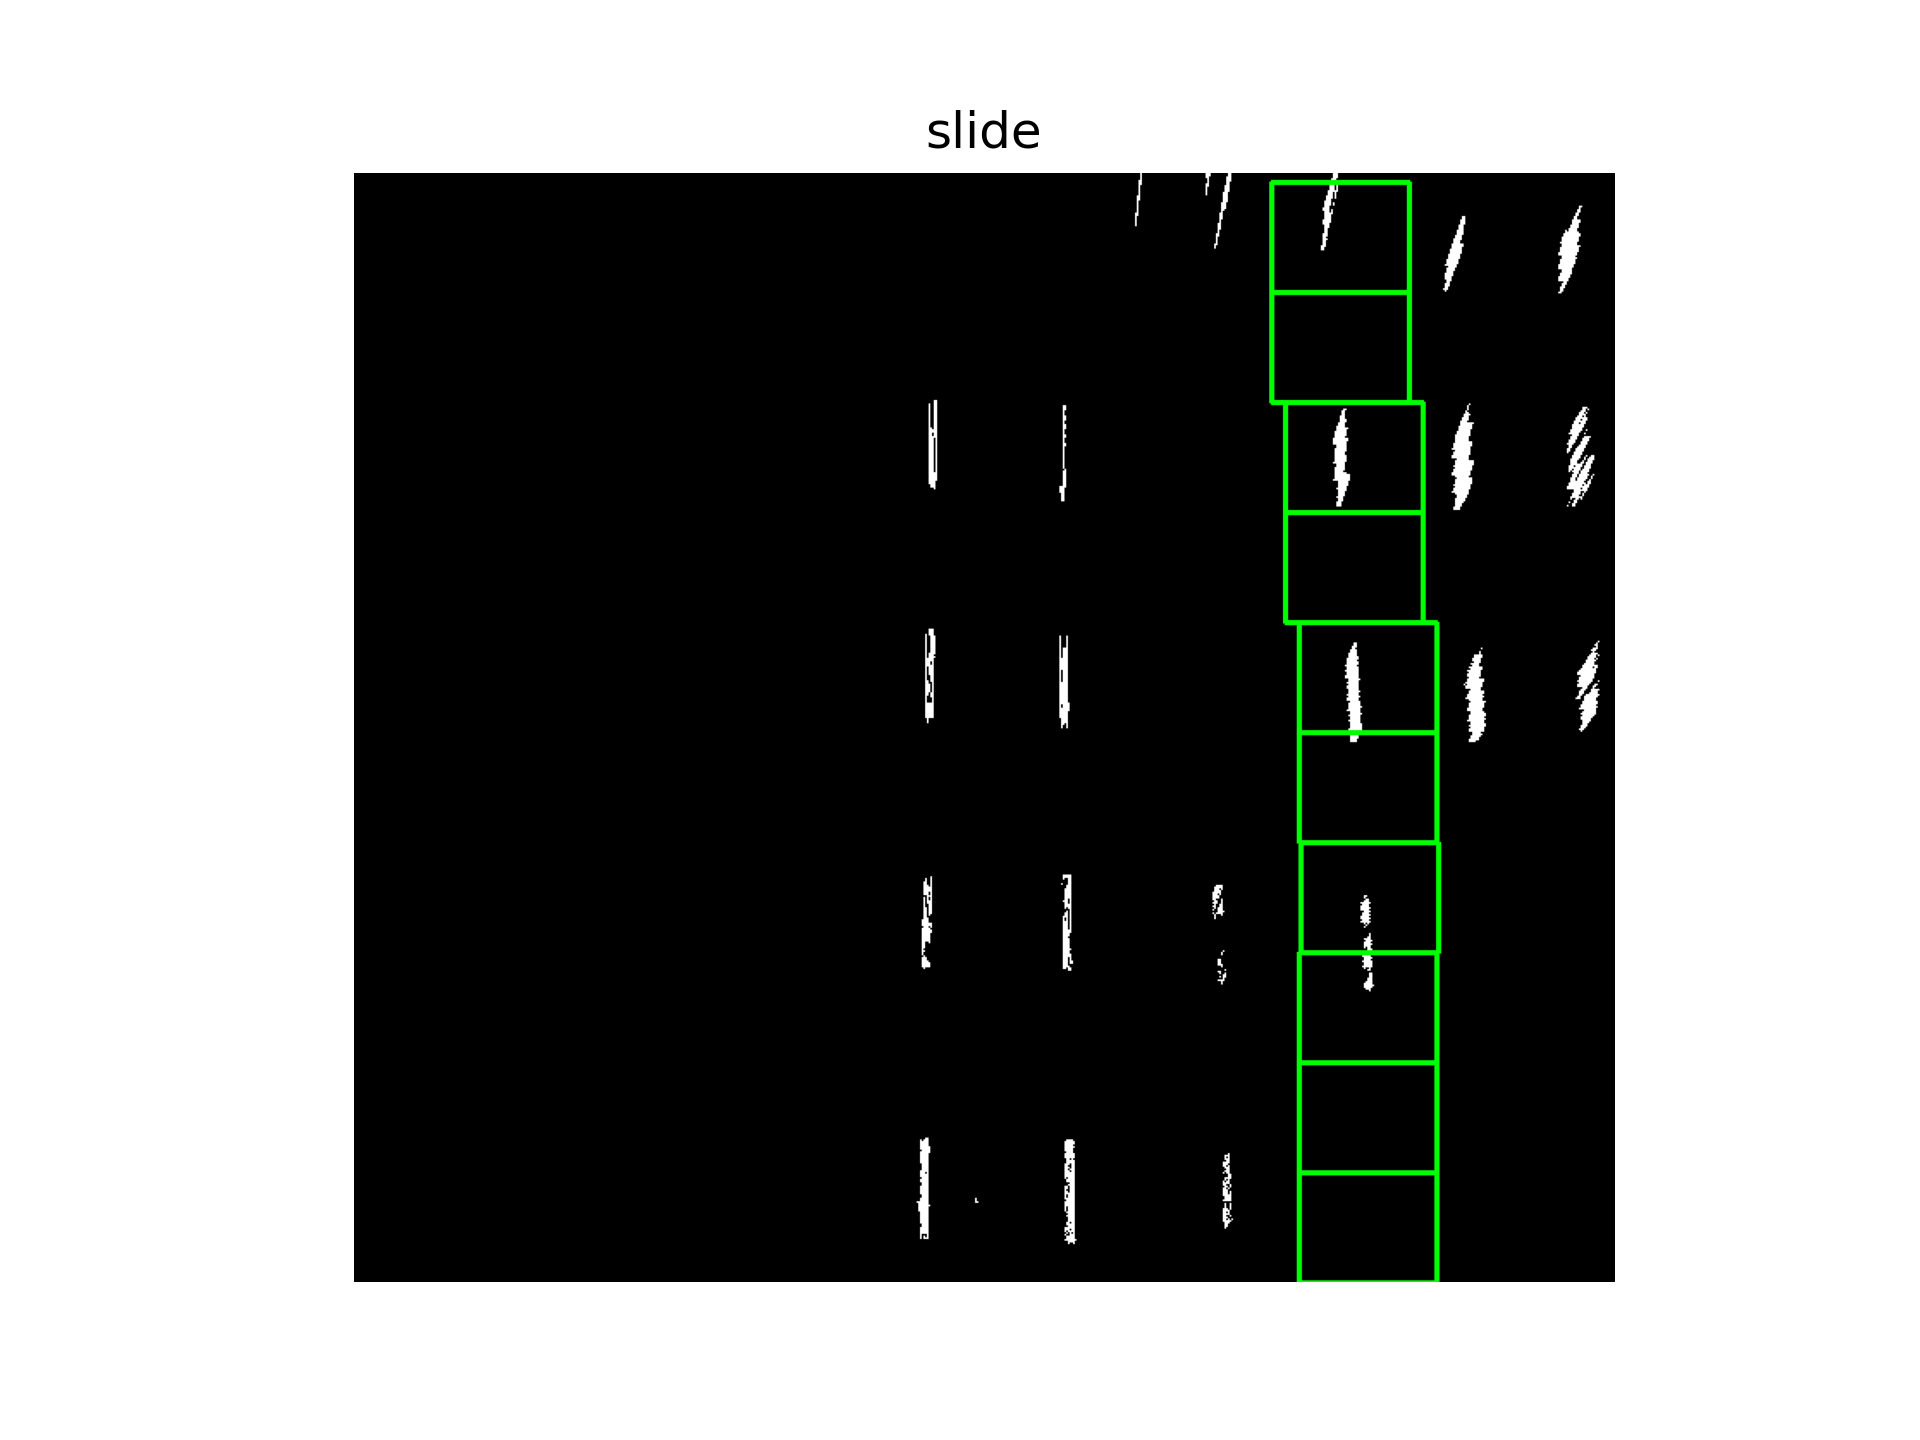
在此基础上,通过滑动窗口法寻找曲线。
centroids = find_all_starter_centroids(warped_image)
all_lines = []
peak_thresh = 10
showMe = 1
sliding_window_specs = {'width':80,'n_steps':10}
print(centroids)
for c in centroids:
    log = run_sliding_window(
        warped_image,
        c,
        sliding_window_specs,
        peak_thresh,
        showMe=showMe
    )
    all_lines.append(log)
这里设定的阈值一共找到4条线:
5.在检测区域中画出并拟合
buffer_sz = 5
ym_per_pix = 12/450
xm_per_pix = 3.7/911
bestfit = {'a0':deque([],maxlen=buffer_sz),
'a1':deque([],maxlen = buffer_sz),
'a2':deque([],maxlen=buffer_sz)}
bestfit_real = {'a0':deque([],maxlen=buffer_sz),
'a1':deque([],maxlen=buffer_sz),
'a2':deque([],maxlen=buffer_sz)}
radOfCurv_tracker = deque([],maxlen=buffer_sz)
all_lane_points = []
all_lane_points_real = []
for line in all_lines:
allx = deque([],maxlen=buffer_sz)
ally = deque([],maxlen=buffer_sz)
update_tracker('hotpixels',line,bestfit,bestfit_real,radOfCurv_tracker,allx,ally)
multiframe = {
'x':[val for sublist in allx for val in sublist],
'y':[val for sublist in ally for val in sublist]
}
fit = polynomial_fit(multiframe)
fit_real = polynomial_fit({'x':[i*ym_per_pix for i in multiframe['x']],
'y':[i*xm_per_pix for i in multiframe['y']]})
all_lane_points.append(fit)
all_lane_points_real.append(fit_real)
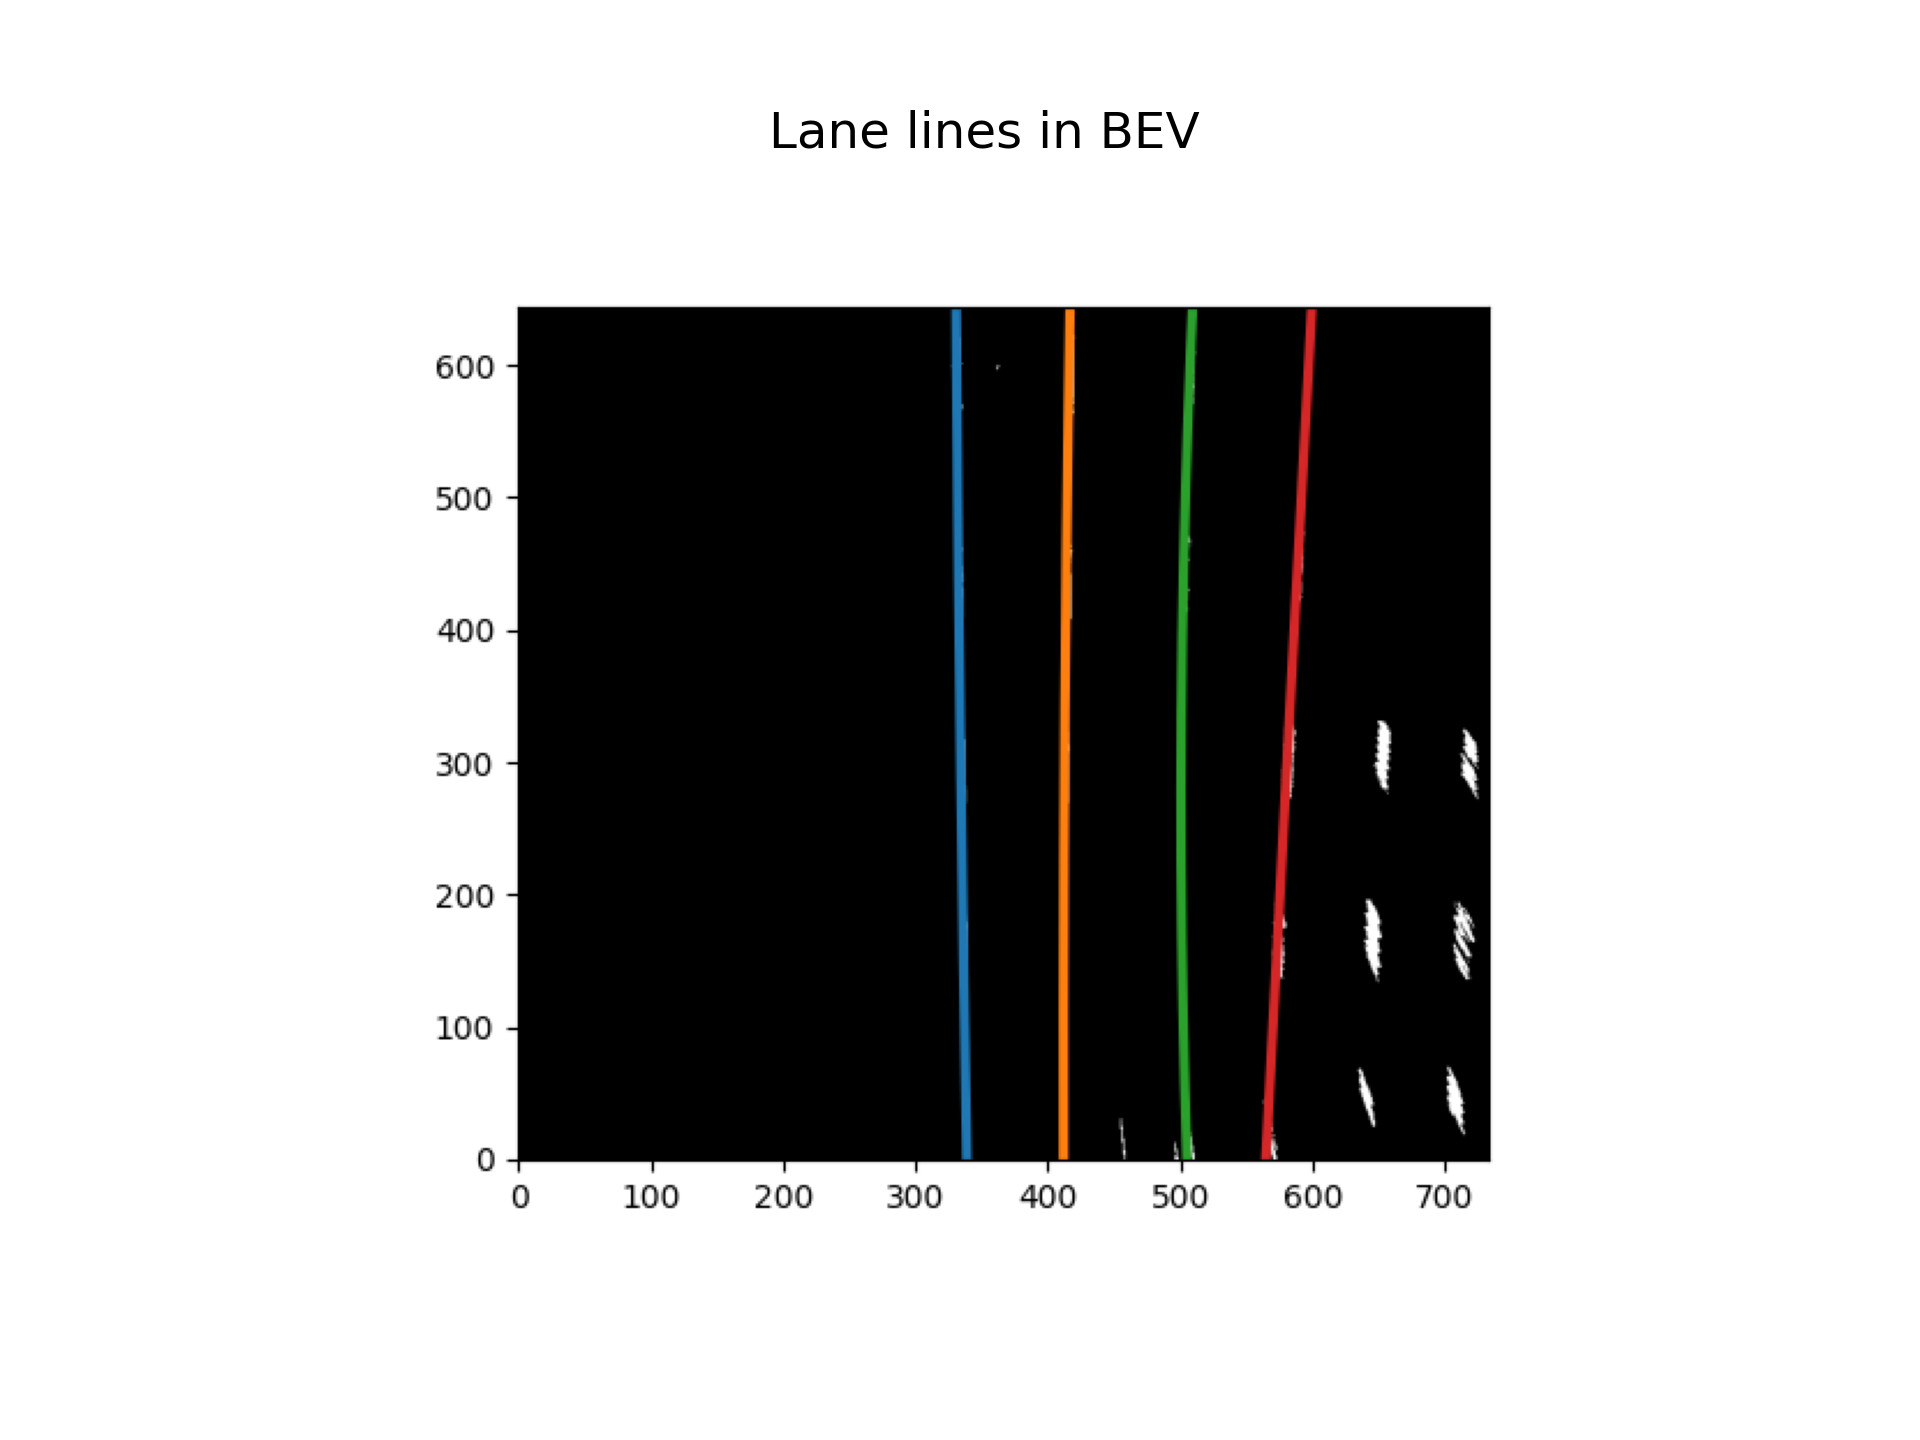
fig, ax = plt.subplots()
ax.imshow(warped_image, cmap='gray')
for fit in all_lane_points:
pred = predict_line(0, warped_image.shape[0], fit)
ax.plot(pred[:,1], pred[:,0], linewidth=3)
ax.invert_yaxis()
canvas = fig.canvas
canvas.draw()
img_array = np.frombuffer(canvas.tostring_rgb(), dtype=np.uint8)
img_array = img_array.reshape(canvas.get_width_height()[::-1] + (3,))
plt.close(fig)
display(img_array, 'Lane lines in BEV', color=1)
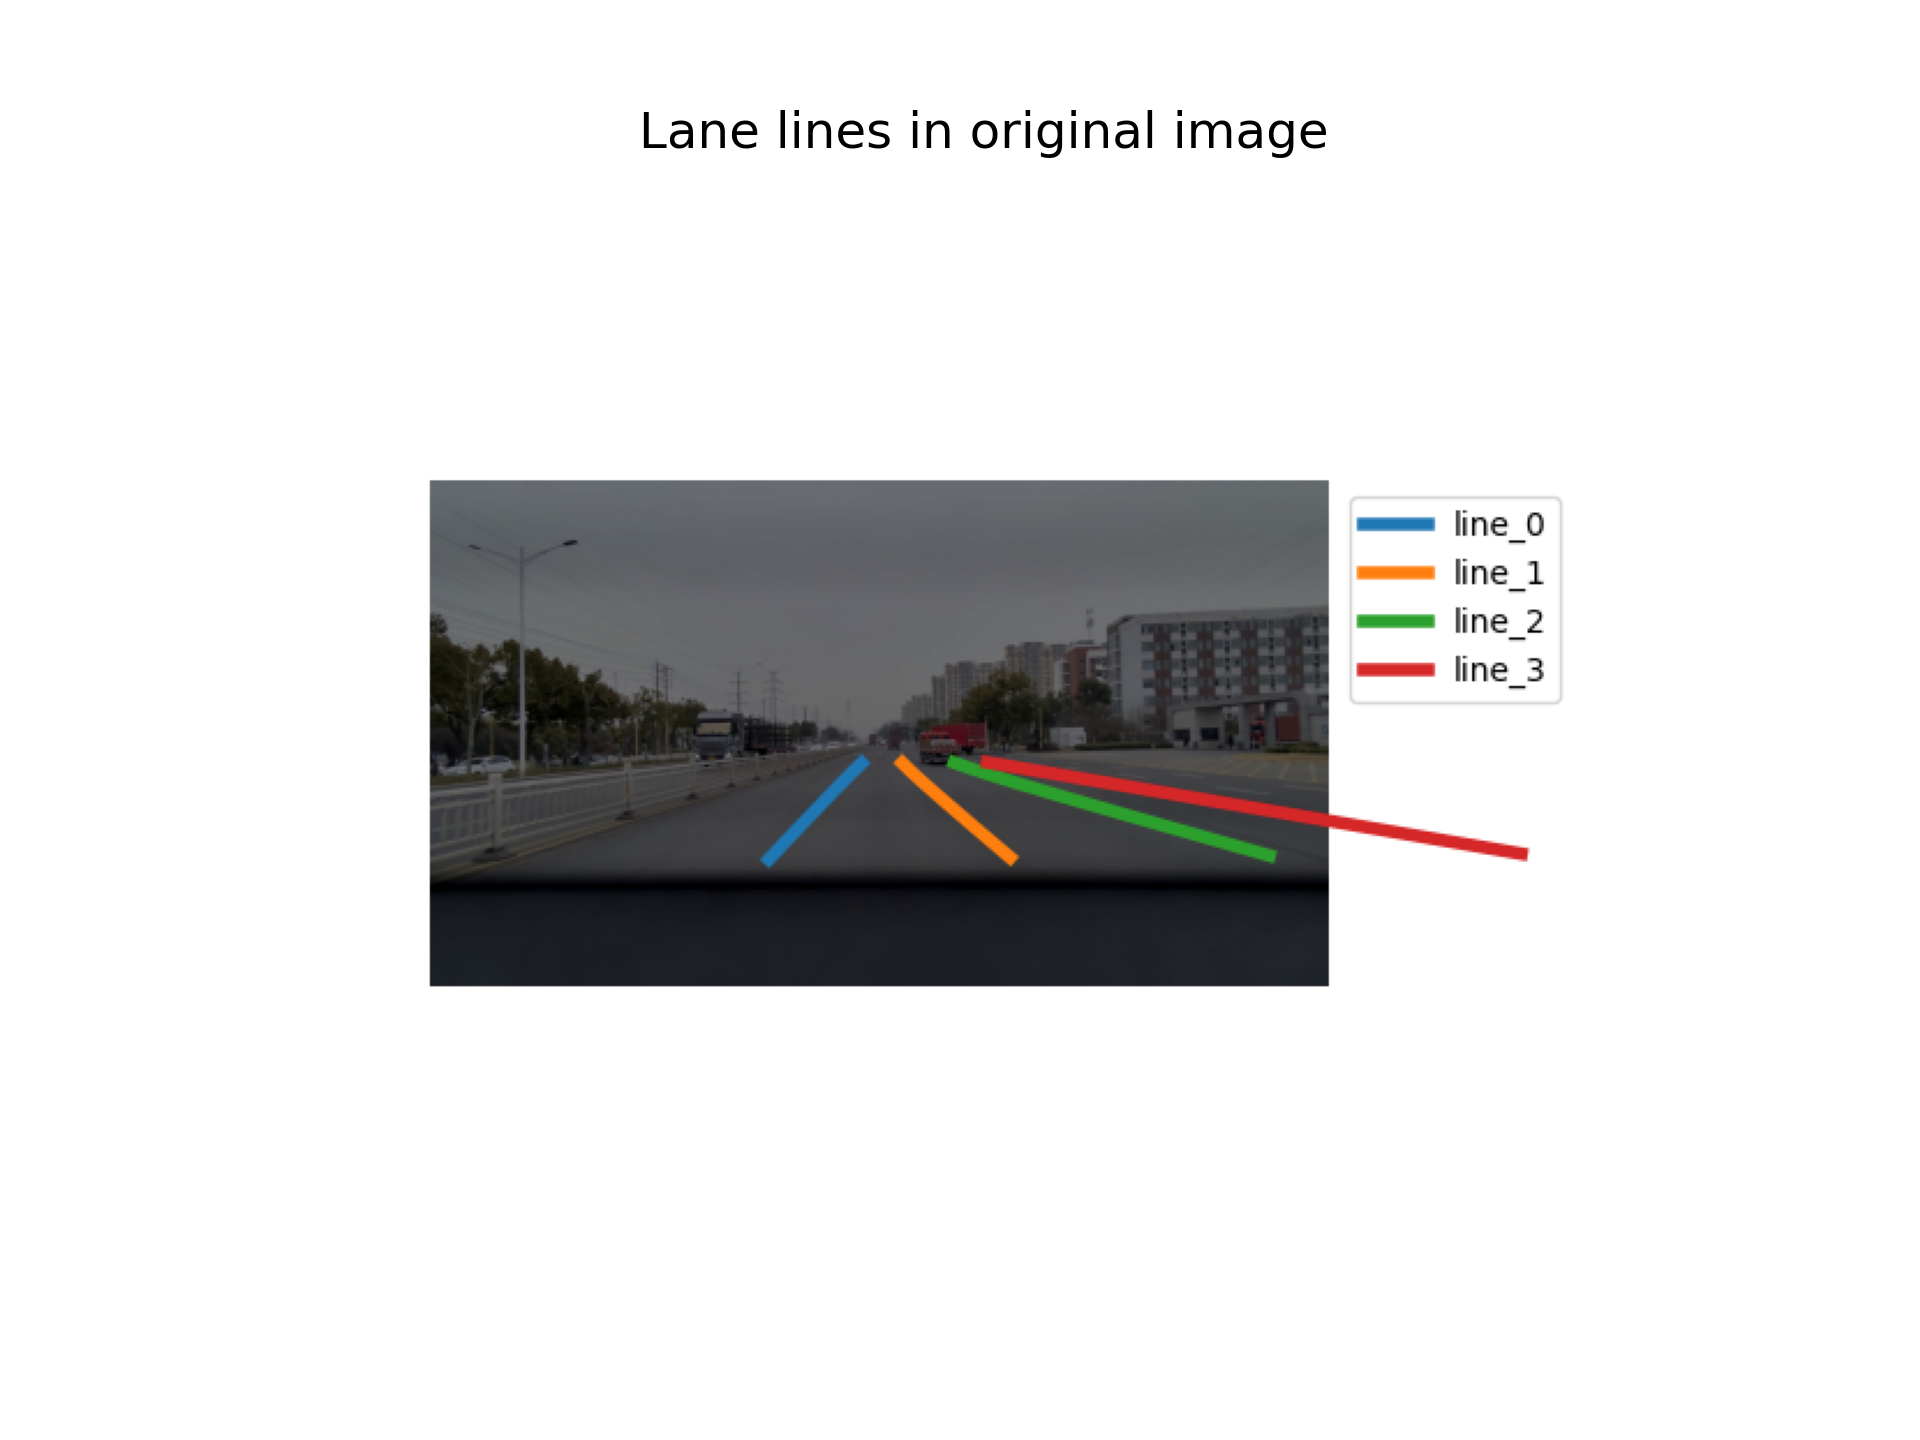
6.转换到原图坐标下
在转换成bev时,需要记录下H矩阵,进行逆变换时需要。
perspective_matrix_inv = np.linalg.inv(perspective_matrix)
fig, ax = plt.subplots()
ax.imshow(distorted_img)
for i, line in enumerate(lines_in_ori):
    x_pts = line[:, 0]
    y_pts = line[:, 1]

    ax.plot(x_pts, y_pts, linewidth=4, label=f"line_{i}")
    ax.legend()

ax.axis('off')

canvas = fig.canvas
canvas.draw()
img_array = np.frombuffer(canvas.tostring_rgb(), dtype=np.uint8)
img_array = img_array.reshape(canvas.get_width_height()[::-1] + (3,))
plt.close(fig)

display(img_array, 'Lane lines in original image', color=1)
Last modified on 2026-03-16